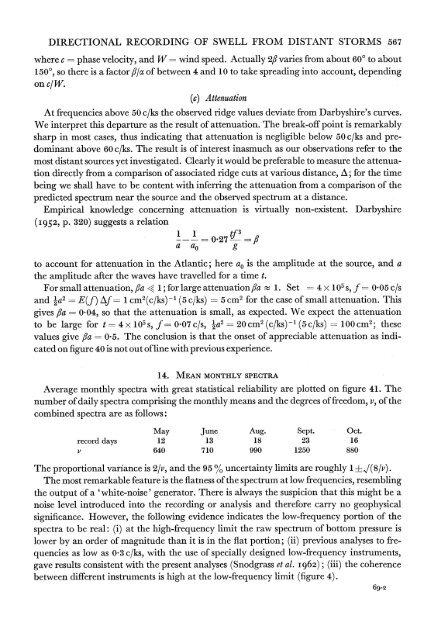
DIRECTIONAL RECORDING OF SWELL FROM DISTANT STORMS 567where c = phase velocity, and W = wind speed. Actually 2,B varies <strong>from</strong> about 600 to about1500, so there is a factor flfx <strong>of</strong> between 4 and 10 to take spreading into account, dependingon c/W.(c) AttenuationAt frequencies above 50 c/ks the observed ridge values deviate <strong>from</strong> Darbyshire's curves.We interpret this departure as the result <strong>of</strong> attenuation. The break-<strong>of</strong>f point is remarkablysharp in most cases, thus indicating that attenuation is negligible below 50 c/ks and predominantabove 60 c/ks. The result is <strong>of</strong> interest inasmuch as our observations refer to themost distant sources yet investigated. Clearly it would be preferable to measure the attenuationdirectly <strong>from</strong> a comparison <strong>of</strong> associated ridge cuts at various distance, A; for the timebeing we shall have to be content with inferring the attenuation <strong>from</strong> a comparison <strong>of</strong> thepredicted spectrum near the source and the observed spectrum at a distance.Empirical knowledge concerning attenuation is virtually non-existent. Darbyshire(1952, p. 320) suggests a relation0-27 =fla aO gto account for attenuation in the Atlantic; here ao is the amplitude at the source, and athe amplitude after the waves have travelled for a time t.For small attenuation, /Ia < 1; for large attenuation fla I 1. Set = 4 x 10⁵ S. f = 0.05 c/sand 2a2= E(f) Af - 1 cm2(c/ks) - (5 c/ks)= 5cm2 for the case <strong>of</strong> small attenuation. Thisgives /Ia = 0*04, so that the attenuation is small, as expected. We expect the attenuationto be large for t = 4 x10⁵ S, f = 0.07 c/s, 1a2 20 cm2 (c/ks)-1 (Sc/ks) 100 cm2; thesevalues give /Ia = 0-5. The conclusion is that the onset <strong>of</strong> appreciable attenuation as indicatedon figure 40 is not out <strong>of</strong> line with previous experience.14. MEAN MONTHLY SPECTRAAverage monthly spectra with great statistical reliability are plotted on figure 41. Thenumber <strong>of</strong> daily spectra comprising the monthly means and the degrees <strong>of</strong> freedom, v, <strong>of</strong> thecombined spectra are as follows:May June Aug. Sept. Oct.record days 12 13 18 23 16v 640 710 990 1250 880The proportional variance is 2/v, and the 95 % uncertainty limits are roughly 1 ? 1(8/v).The most remarkable feature is the flatness <strong>of</strong> the spectrum at low frequencies, resemblingthe output <strong>of</strong> a 'white-noise' generator. There is always the suspicion that this might be anoise level introduced into the recording or analysis and therefore carry no geophysicalsignificance. However, the following evidence indicates the low-frequency portion <strong>of</strong> thespectra to be real: (i) at the high-frequency limit the raw spectrum <strong>of</strong> bottom pressure islower by an order <strong>of</strong> magnitude than it is in the flat portion; (ii) previous analyses to frequenciesas low as 0 3 c/ks, with the use <strong>of</strong> specially designed low-frequency instruments,gave results consistent with the present analyses (Snodgrass et al. I962); (iii) the coherencebetween different instruments is high at the low-frequency limit (figure 4).69-2
568 W. H. MUNK, G. R. MILLER, F. E. SNODGRASS AND N. F. BARBERStill there remains some concern. Consider for example the spreading <strong>of</strong> the spectrumdue to the limited duration <strong>of</strong> the record. The time record may be considered as a record <strong>of</strong>infinite length, multiplied by a functionf(t) = 1 between t= --IT to t= +IT,and zero otherwise. The Fourier transform <strong>of</strong> this function is Tsin q/qS, with0 iTf T - afNAt - jiTNx, X =f/1fNwherefN = (2At) -I is the nyquist frequency for a sampling rate At, and N the number <strong>of</strong>observations in the time series. Then if E(0) is the power spectrum <strong>of</strong> the infinite record, thespectrum for a record <strong>of</strong> length T is given by|E(o6-so)12n, -do100_-- X _- - - - - - ~~~~~~~~~~~~~~~~~~~~~OCT_,_=MAY.10- 95% CONFIDENCE LIMIT - - SEPT.............AUG.012 lJUNE010.01 ';-~2z~----..2z-:-T---zzr.~. -0001 L -I~~~~~~~~~~~~~~~~~~~~~~~~~~~~~~~~~AUG....* 7 E ...... - * ~~~~~~~~~~~~~~~~~~~~0 20 40 60 80 100 120c/ksFIGURE 41. The average spectra for all records during the months <strong>of</strong> May, June, August, September,and October 1959, respectively. The 90 percent confidence limits for May are shown; for othermonths the expected variance is even smaller.Suppose E(0) is constant in the frequency interval xi to x2 nyquists, and zero elsewhere.We wish to compute the spectrum at X3, well outside the range xl to x2. This permits us toreplace sin2 b' by its mean value, j. The computed spectrum at xi is then given by1 X'-XXI x-2dx= N( 1 I_ )T2NJX2_X17 X3-X1 X2-X1/The expression in the parenthesis contains a numerical factor that increases with the width,x2-xI, <strong>of</strong> the primary spectral band, and with the proximity <strong>of</strong> xl to this band. The 'contamination'varies inversely with the record length. For our analyses N is usually 3000,and the contamination <strong>from</strong> the energetic band into the low frequencies is <strong>of</strong> the order 10-4.If the energetic band is coherent at the three instruments, then the contamination should becoherent also, and the foregoing argument (iii) is not convincing.Since the observed energy density at low frequencies is typically 10- times the peakenergy (figure 41) the contamination appears to be barely avoided. To check this conclusion,we have taken the very long record <strong>of</strong> 16 October (N =9000), split it into three equallengths, and compared the ratio <strong>of</strong> low-frequency energy density <strong>of</strong> the long record to the
- Page 1 and 2:
Directional Recording of Swell from
- Page 3 and 4:
506 W. H. MUNK, G. R. MILLER, F. E.
- Page 5 and 6:
508 W. H. MUNK, G. R. MILLER, F. E.
- Page 7 and 8:
510 W. H. MUNK, G. R. MILLER, F. E.
- Page 9 and 10:
512 W. H. MUNK, G. R. MILLER, F. E.
- Page 11 and 12:
514 W. H. MUNK, G. R. MILLER, F. E.
- Page 13 and 14: 516 W. H. MUNK, G. R. MILLER, F. E.
- Page 15 and 16: 518 W. H. MUNK, G. R. MILLER, F. E.
- Page 17 and 18: 520 W. H. MUNK, G. R. MILLER, F. E.
- Page 19 and 20: 522 W. H. MUNK, G. R. MILLER, F. E.
- Page 21 and 22: 524 W. H. MUNK, G. R. MILLER, F. E.
- Page 23 and 24: 526 W. H. MUNK, G. R. MILLER, F. E.
- Page 25 and 26: 528 W. H-. MUNK, G. R. MILLER, F. E
- Page 27 and 28: 530 W. H. MUNK, G. R. MILLER, F. E.
- Page 29 and 30: 532 W. H. MUNK, G. R. MILLER, F. E.
- Page 31 and 32: 534 W. H. MUNK, G. R. MILLER, F. E.
- Page 33 and 34: 00207'-0.C-0-01~~~~~~~~~~~~~~~~~~~~
- Page 35 and 36: 538714Cld0,9~~~~~~~U0CldCIO.0a.)a.)
- Page 37 and 38: 540 W. H. MUNK, G. R. MILLER, F. E.
- Page 39 and 40: 542 W. H. MUNK, G. R. MILLER, F. E.
- Page 41 and 42: 544 W. H. MUNK, G. R. MILLER, F. E.
- Page 43 and 44: 546 W. H. MUNK, G. R. MILLER, F. E.
- Page 45 and 46: 548 W. H. MUNK, G. R. MILLER, F. E.
- Page 47 and 48: 550 W. H. MUNK, G. R. MILLER, F. E.
- Page 49 and 50: 140? 1300 1200 1100 1000 900 80016t
- Page 51 and 52: ;554 W. H. MUNK, G. R. MILLER, F. E
- Page 53 and 54: 556 W. H. MUNK, G. R. MILLER, F. E.
- Page 55 and 56: 558 W. H. MUNK, G. R. MILLER, F. E.
- Page 57 and 58: 560 W. H. MUNK, G. R. MILLER, F. E.
- Page 59 and 60: 562 W. H. MUNK, G. R. MILLER, F. E.
- Page 61 and 62: 564 W. H. MUNK, G. R. MILLER, F. E.
- Page 63: 566 W. H. MUNK, G. R. MILLER, F. E.
- Page 67 and 68: 570 W. H. MUNK, G. R. MILLER, F. E.
- Page 69 and 70: 572 W. H. MUNK, G. R. MILLER, F. E.
- Page 71 and 72: 574 W. H. MUNK, G. R. MILLER, F. E.
- Page 73 and 74: 576 W. H. MUNK, G. R. MILLER, F. E.
- Page 75: 578 W. H. MUNK, G. R. MILLER, F. E.
- Page 78 and 79: Munk et al. Phil. Trans A, volume 2
- Page 80 and 81: 582 W. H. MUNK, G. R. MILLER, F. E.
- Page 82: 584 W. H. MUNK, G. R. MILLER, F. E.


