Directional Recording of Swell from Distant Storms - Department of ...
Directional Recording of Swell from Distant Storms - Department of ...
Directional Recording of Swell from Distant Storms - Department of ...

Create successful ePaper yourself
Turn your PDF publications into a flip-book with our unique Google optimized e-Paper software.
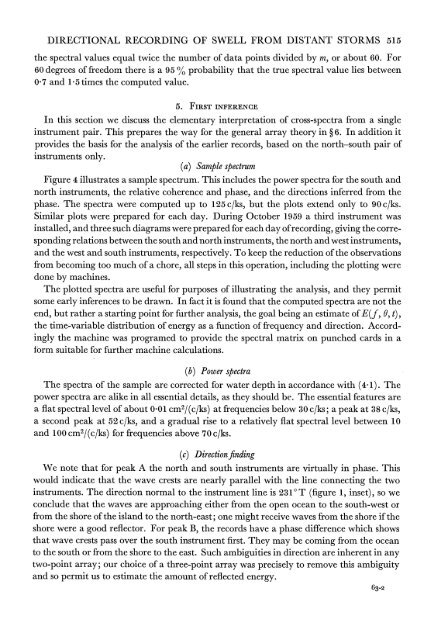
DIRECTIONAL RECORDING OF SWELL FROM DISTANT STORMS 515the spectral values equal twice the number <strong>of</strong> data points divided by m, or about 60. For60 degrees <strong>of</strong> freedom there is a 95 % probability that the true spectral value lies between0 7 and I *5 times the computed value.5. FIRST INFERENCEIn this section we discuss the elementary interpretation <strong>of</strong> cross-spectra <strong>from</strong> a singleinstrument pair. This prepares the way for the general array theory in ? 6. In addition itprovides the basis for the analysis <strong>of</strong> the earlier records, based on the north-south pair <strong>of</strong>instruments only.(a) Sample spectrumFigure 4 illustrates a sample spectrum. This includes the power spectra for the south andnorth instruments, the relative coherence and phase, and the directions inferred <strong>from</strong> thephase. The spectra were computed up to 125 c/ks, but the plots extend only to 90 c/ks.Similar plots were prepared for each day. During October 1959 a third instrument wasinstalled, and three such diagrams were prepared for each day <strong>of</strong> recording, giving the correspondingrelations between the south and north instruments, the north and west instruments,and the west and south instruments, respectively. To keep the reduction <strong>of</strong> the observations<strong>from</strong> becoming too much <strong>of</strong> a chore, all steps in this operation, including the plotting weredone by machines.The plotted spectra are useful for purposes <strong>of</strong> illustrating the analysis, and they permitsome early inferences to be drawn. In fact it is found that the computed spectra are not theend, but rather a starting point for further analysis, the goal being an estimate <strong>of</strong> E(f, 0, t),the time-variable distribution <strong>of</strong> energy as a function <strong>of</strong> frequency and direction. Accordinglythe machine was programed to provide the spectral matrix on punched cards in atorm suitable for further machine calculations.(b) Power spectraThe spectra <strong>of</strong> the sample are corrected for water depth in accordance with (4.1). Thepower spectra are alike in all essential details, as they should be. The essential features area flat spectral level <strong>of</strong> about 0.01 cm2/(c/ks) at frequencies below 30 c/ks; a peak at 38 c/ks,a second peak at 52 c/ks, and a gradual rise to a relatively flat spectral level between 10and 100 cm2/(c/ks) for frequencies above 70 c/ks.(c) Direction findingWe note that for peak A the north and south instruments are virtually in phase. Thiswould indicate that the wave crests are nearly parallel with the line connecting the twoinstruments. The direction normal to the instrument line is 231?T (figure 1, inset), so weconclude that the waves are approaching either <strong>from</strong> the open ocean to the south-west or<strong>from</strong> the shore <strong>of</strong> the island to the north-east; one might receive waves <strong>from</strong> the shore if theshore were a good reflector. For peak B, the records have a phase difference which showsthat wave crests pass over the south instrument first. They may be coming <strong>from</strong> the oceanto the south or <strong>from</strong> the shore to the east. Such ambiguities in direction are inherent in anytwo-point array; our choice <strong>of</strong> a three-point array was precisely to remove this ambiguityand so permit us to estimate thie amounlt <strong>of</strong> reflected energy.63-2