Directional Recording of Swell from Distant Storms - Department of ...
Directional Recording of Swell from Distant Storms - Department of ...
Directional Recording of Swell from Distant Storms - Department of ...
Create successful ePaper yourself
Turn your PDF publications into a flip-book with our unique Google optimized e-Paper software.
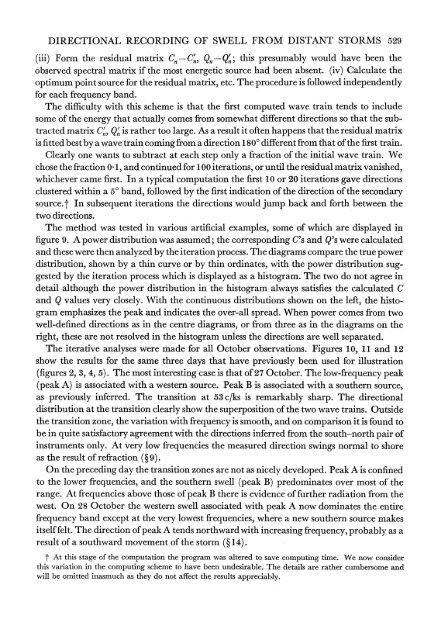
DIRECTIONAL RECORDING OF SWELL FROM, DISTANT STORMS 529Qn -Qn; this presumably would have been the(iii) Form the residual matrix C, -Cn,observed spectral matrix if the most energetic source had been absent. (iv) Calculate theoptimum point source for the residual matrix, etc. The procedure is followed independentlyfor each frequency band.The difficulty with this scheme is that the first computed wave train tends to includesome <strong>of</strong> the energy that actually comes <strong>from</strong> somewhat different directions so that the sub-is rather too large. As a result it <strong>of</strong>ten happens that the residual matrixis fitted best by a wave train coming <strong>from</strong> a direction 1800 different <strong>from</strong> that <strong>of</strong> the first train.Clearly one wants to subtract at each step only a fraction <strong>of</strong> the initial wave train. Wechose the fraction 0 1, and continued for 100 iterations, or until the residual matrix vanished,whichever came first. In a typical computation the first 10 or 20 iterations gave directionsclustered within a 50 band, followed by the first indication <strong>of</strong> the direction <strong>of</strong> the secondarysource.t In subsequent iterations the directions would jump back and forth between thetwo directions.The method was tested in various artificial examples, some <strong>of</strong> which are displayed infigure 9. A power distribution was assumed; the corresponding C's and Q's were calculatedand these were then analyzed by the iteration process. The diagrams compare the true powerdistribution, shown by a thin curve or by thin ordinates, with the power distribution suggestedby the iteration process which is displayed as a histogram. The two do not agree indetail although the power distribution in the histogram always satisfies the calculated Cand Q values very closely. With the continuous distributions shown on the left, the histogramemphasizes the peak and indicates the over-all spread. When power comes <strong>from</strong> twowell-defined directions as in the centre diagrams, or <strong>from</strong> three as in the diagrams on theright, these are not resolved in the histogram unless the directions are well separated.The iterative analyses were made for all October observations. Figures 10, 11 and 12show the results for the same three days that have previously been used for illustration(figures 2, 3, 4, 5). The most interesting case is that <strong>of</strong> 27 October. The low-frequency peak(peak A) is associated with a western source. Peak B is associated with a southern source,as previously inferred. The transition at 53 c/ks is remarkably sharp. The directionaldistribution at the transition clearly show the superposition <strong>of</strong> the two wave trains. Outsidethe transition zone, the variation with frequency is smooth, and on comparison it is found tobe in quite satisfactory agreement with the directions inferred <strong>from</strong> the south-north pair <strong>of</strong>instruments only. At very low frequencies the measured direction swings normal to shoreas the result <strong>of</strong> refraction (? 9).On the preceding day the transition zones are not as nicely developed. Peak A is confinedto the lower frequencies, and the southern swell (peak B) predominates over most <strong>of</strong> therange. At frequencies above those <strong>of</strong> peak B there is evidence <strong>of</strong> further radiation <strong>from</strong> thewest. On 28 October the western swell associated with peak A now dominates the entirefrequency band except at the very lowest frequencies, where a new southern source makesitself felt. The direction <strong>of</strong> peak A tends northward with increasing frequency, probably as aresult <strong>of</strong> a southward movement <strong>of</strong> the storm (? 14).tracted matrix Cn, Qnt At this stage <strong>of</strong> the computation the program was altered to save computing time. We now considerthis variation in the computing scheme to have been undesirable. The details are rather cumbersome andwill be omitted inasmuch as they do not affect the results appreciably.


