Directional Recording of Swell from Distant Storms - Department of ...
Directional Recording of Swell from Distant Storms - Department of ...
Directional Recording of Swell from Distant Storms - Department of ...

You also want an ePaper? Increase the reach of your titles
YUMPU automatically turns print PDFs into web optimized ePapers that Google loves.
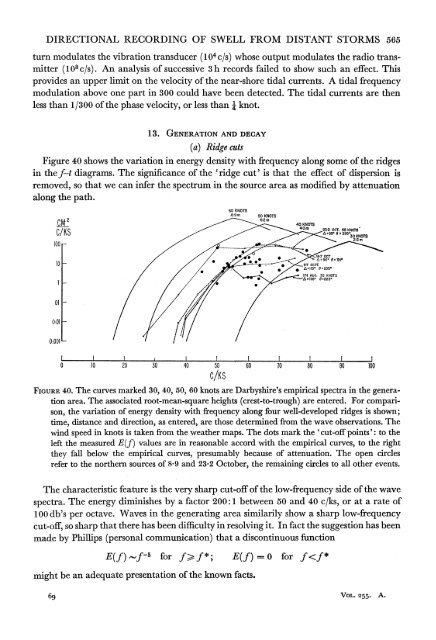
DIRECTIONAL RECORDING OF SWELL FROM DISTANT STORMS 565turn modulates the vibration transducer (1 04 c/s) whose output modulates the radio transmitter(108 c/s). An analysis <strong>of</strong> successive 3 h records failed to show such an effect. Thisprovides an upper limit on the velocity <strong>of</strong> the near-shore tidal currents. A tidal frequencymodulation above one part in 300 could have been detected. The tidal currents are thenless than 1/300 <strong>of</strong> the phase velocity, or less than W knot.13. GENERATION AND DECAY(a) Ridge cutsFigure 40 shows the variation in energy density with frequency along some <strong>of</strong> the ridgesin thef-t diagrams. The significance <strong>of</strong> the 'ridge cut' is that the effect <strong>of</strong> dispersion isremoved, so that we can infer the spectrum in the source area as modified by attenuationalong the path.60 kNOTS.8 9 m 50 KNOTS.Ct42~~~~~~~~~~~~~~~~~~~~~~~~~~~-_w ~~~~~~~~~~~_,~ E 40 KNOX100GAS~ ~ ~~~~~~~~~r\ r * A15? 20S? 8250T0*001 !7/ /I I _ _ I I I0 10 20 30 40 50 60 70 80 90 100C/KSFIGURE 40. The curves marked 30, 40, 50, 60 knots are Darbyshire's empirical spectra in the generationarea. The associated root-mean-square heights (crest-to-trough) are entered. For comparison,the variation <strong>of</strong> energy density with frequency along four well-developed ridges is shown;time, distance and direction, as entered, are those determined <strong>from</strong> the wave observrations. Thewind speed in knots is taken <strong>from</strong>n the weather maps. The dots mark the ' cut-<strong>of</strong>f points ': to theleft the measured E(f) values are in reasonable accord with the empirical curves, to the rightthey fall below the empirical curves,- presumably because <strong>of</strong> attenuation. The open circlesrefer to the northern sources <strong>of</strong> 8-9 and 23'2 October, the remaining circles to all other events.The characteristic feature is the very sharp cut-<strong>of</strong>f <strong>of</strong> the low-frequency side <strong>of</strong> the wavespectra. The energy diminishes by a factor 200:1 between 50 and 40 c/ks, or at a rate <strong>of</strong>100 db's per octave. Waves in the generating area- similarily show a sharp low-frequencycut-<strong>of</strong>f, so sharp that there has been difficulty in resolving it. In fact the suggestion has beenmade by Phillips (personal communication) that a discontinuous functionE(f>~f5 for f>f*; E(f)-0 for f