Directional Recording of Swell from Distant Storms - Department of ...
Directional Recording of Swell from Distant Storms - Department of ...
Directional Recording of Swell from Distant Storms - Department of ...
You also want an ePaper? Increase the reach of your titles
YUMPU automatically turns print PDFs into web optimized ePapers that Google loves.
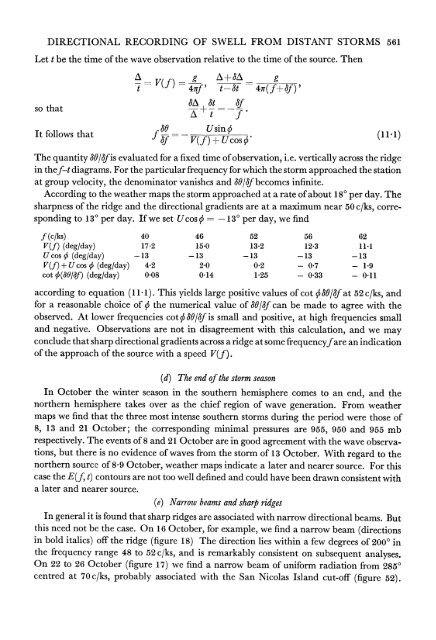
DIRECTIONAL RECORDING OF SWELL FROM DISTANT STORMS 561Let t be the time <strong>of</strong> the wave observation relative to the time <strong>of</strong> the source. ThenA _V"U g. A+&A _ gt 4V(Z)t= 44' t -t =ffso thatA + At _fIt follows thatUsf in0 (11 1)4f V(f) +U Cos q'The quantity 4O/1fis evaluated for a fixed time <strong>of</strong> observation, i.e. vertically across the ridgein thef-t diagrams. For the particular frequency for which the storm approached the stationat group velocity, the denominator vanishes and &O/&f becomes infinite.According to the weather maps the storm approached at a rate <strong>of</strong> about 18? per day. Thesharpness <strong>of</strong> the ridge and the directional gradients are at a maximum near 50 c/ks, correspondingto 130 per day. If we set Ucos q - 13? per day, we findf (c/ks) 40 46 52 56 62V(f) (deg/day) 17-2 15.0 13.2 12*3 11.1U cos 0 (deg/day) -13 -13 -13 -13 -13V(f)+ Ucos 0 (deg/day) 4i2 2-0 0.2 - 0 7 - 1.9cot S(80/8f) (deg/day) 0.08 0-14 1F25 - 0.33 - 0.11according to equation (11 1). This yields large positive values <strong>of</strong> cot S0 3f/f at 52 c/ks, andfor a reasonable choice <strong>of</strong> qS the numerical value <strong>of</strong> 801/f can be made to agree with theobserved. At lower frequencies cot q 30/Sf is small and positive, at high frequencies smalland negative. Observations are not in disagreement with this calculation, and we mayconclude that sharp directional gradients across a ridge at some frequencyfare an indication<strong>of</strong> the approach <strong>of</strong> the source with a speed V(f).(d) The end <strong>of</strong> the storm seasonIn October the winter season in the southern hemisphere comes to an end, and thenorthern hemisphere takes over as the chief region <strong>of</strong> wave generation. From weathermaps we find that the three most intense southern storms during the period were those <strong>of</strong>8, 13 and 21 October; the corresponding minimal pressures are 955, 950 and 955 mbrespectively. The events <strong>of</strong> 8 and 21 October are in good agreement with the wave observations,but there is no evidence <strong>of</strong> waves <strong>from</strong> the storm <strong>of</strong> 13 October. With regard to thenorthern source <strong>of</strong> 8-9 October, weather maps indicate a later and nearer source. For thiscase the E(f, t) contours are not too well defined and could have been drawn consistent witha later and nearer source.(e) Narrow beams and sharp ridgesIn general it is found that sharp ridges are associated with narrow directional beams. Butthis need not be the case. On 16 October, for example, we find a narrow beam (directionsin bold italics) <strong>of</strong>f the ridge (figure 18) The direction lies within a few degrees <strong>of</strong> 2000 inthe frequency range 48 to 52 c/ks, and is remarkably consistent on subsequent analyses.On 22 to 26 October (figure 17) we find a narrow beam <strong>of</strong> uniform radiation <strong>from</strong> 2850centred at 70 c/ks, probably associated with the San Nicolas Island cut-<strong>of</strong>f (figure 52).


