Directional Recording of Swell from Distant Storms - Department of ...
Directional Recording of Swell from Distant Storms - Department of ...
Directional Recording of Swell from Distant Storms - Department of ...

Create successful ePaper yourself
Turn your PDF publications into a flip-book with our unique Google optimized e-Paper software.
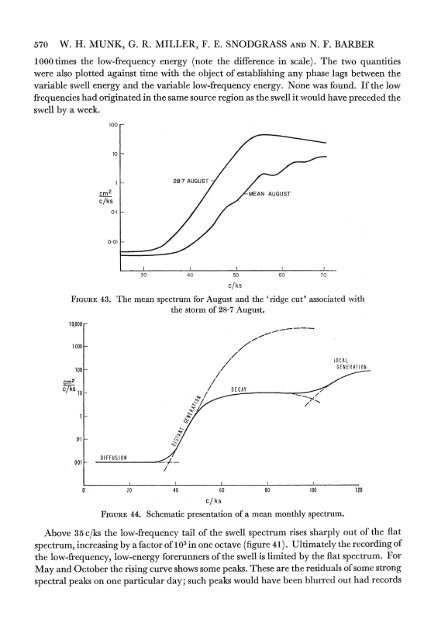
570 W. H. MUNK, G. R. MILLER, F. E. SNODGRASS AND N. F. BARBER1000 times the low-frequency energy (note the difference in scale). The two quantitieswere also plotted against time with the object <strong>of</strong> establishing any phase lags between thevariable swell energy and the variable low-frequency energy. None was found. If the lowfrequencies had originated in the same source region as the swell it would have preceded theswell by a week.10010cm2c/ks0-1L287 AUGUSTMEAN AUGUST0.0130 40 50 60 70c/ksFIGURE 43. The mean spectrum for August and the 'ridge cut' associated withthestorm <strong>of</strong> 28 7 August.10,00oI1000LOCAL100 GENERATIONcm2c/ks 10-01 _0 0 1 USI//o20 40 60 80 lOO 120c/ksFIGURE 44. Schematic presentation <strong>of</strong> a mean monthly spectrum.Above 35 c/ks the low-frequency tail <strong>of</strong> the swell spectrum rises sharply out <strong>of</strong> the flatspectrum, increasing by a factor <strong>of</strong> 103~ in one octave (figure 41) . Ultimately the recording <strong>of</strong>the low-frequency, low-energy forerunners <strong>of</strong> the swell is limited by the flat spectrum. ForMay and October the rising curve shows some peaks. These are the residuals <strong>of</strong> some strongspectral peaks on one particular day; such peaks would have been blurred out had records