DIRECTIONAL RECORDING OF SWELL FROM DISTANT STORMS 517is the phase difference between the two instruments which are separated by a distance D.So there are always two possible wave directions, namely ax and 1800o a that suit ourobserved phase difference 5S.The directions plotted at the bottom <strong>of</strong> figure 4 were computed <strong>from</strong> qS in accordancewith (5.2) but adopting in each case only the direction <strong>from</strong> the seaward side <strong>of</strong> the instrumentpair. For each computed value <strong>of</strong> ax there is an additional solution a' 1800 cx,so that for each computed direction, 0 = 231?0 +c, as plotted, there is another possible direction0' - 282? -0, <strong>from</strong> the shoreward side <strong>of</strong> the array.A further ambiguity arises when the waves are so short that the difference in phase at thetwo instruments exceeds half a cyclet. In comparing records one can estimate only theprincipal value <strong>of</strong> 0, that is, its value in the range ?i -. Its actual value may differ <strong>from</strong> thisby any multiple <strong>of</strong> 2iT. So there may be numerous possible values <strong>of</strong> the direction ax, given bysin acj (q + 2ifj)/(2iTkD), (5.3)wherej is 0, ? 1, + 2, etc., up to the largest value for which sin aj still lies between ? 1.The directions plotted at the bottom <strong>of</strong> figure 4 were computed in accordance with (5.3),ignoring those directions <strong>from</strong> the landward side <strong>of</strong> the pair <strong>of</strong> instruments. The directionis unique for frequencies below 55 c/ks, but two solutions and then three solutions appear asone moves to higher frequencies. For the higher frequencies it seems reasonable to adopt thecurve <strong>of</strong> directions that is continuous with the unique curve <strong>of</strong> directions at the lowerfrequencies. In figure 4, 00(f) is the obvious choice between the three possible directions atthe high-frequency limit. In practice we have found it possible to determine wave directionsfor wavelengths as short as !D (as compared to the limit 2D for experiments conducted ata single frequency). This illustrates the benefit <strong>of</strong> working in a frequency continuum.(d) Beam widthThe coherence R is a guide to the angular spread <strong>of</strong> the waves. Consider for instance twowave trains having the same amplitude, a, but slightly different frequencies, f1 and f2,coming <strong>from</strong> directions ac, and c2 respectively, relative to the normal <strong>of</strong> the pair <strong>of</strong> instruments.The corresponding phase differences are 01 and 02, where01 = 2rk1 D sin a1, 02qS 21k2D sin a2.Thus the wave signals at the instruments may be written1N= a cos 2iTf t+a cos 2rf2 t,=, = acos (2irf1t-01) +acos (2lTf2t-q02).On computing the quantities defined in ?4(d) one findsPNN(T) = PSS(T) - a2 cos 2Tf]1 r + a2 cos 2irf2 r,PSN(T) -a2coqS X cos 2rfff r + a2 COS 02cos 2irf2 r.If now we ignore the slight difference betweenf1 andf2, writing each as f, we getCSS CNN= 2a2,and in particular R-cos 2CSN a2(cos l + cosS 02), QSN = a2(sin 01 + sinOS2),(q1--q2), = 1(A1 +02)t There is a close analogy with the problem <strong>of</strong> aliasing (?4 (b)) when the frequency exceeds half the samplingfrequency.
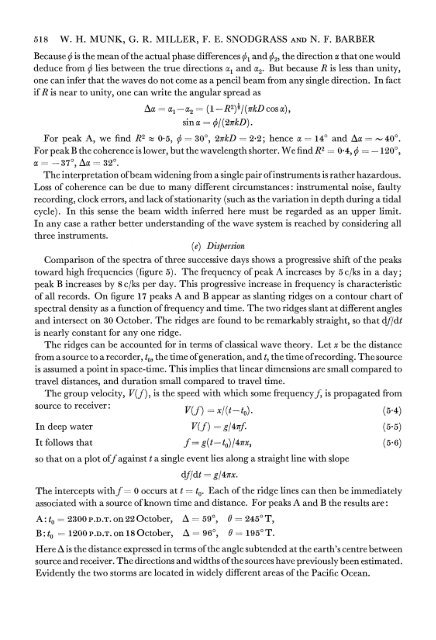
518 W. H. MUNK, G. R. MILLER, F. E. SNODGRASS AND N. F. BARBERBecause 0 is the mean <strong>of</strong> the actual phase differences 01 and 02, the direction a that one woulddeduce <strong>from</strong> 0 lies between the true directions al and a2. But because R is less than unity,one can infer that the waves do not come as a pencil beam <strong>from</strong> any single direction. In factif R is near to unity, one can write the angular spread asAa -1- (1 R2)1/(irkD cos),sina OS/(2irkD).For peak A, we find R2 0 5, q 30?, 2irkD = 2X2; hence a - 14? and Aoa - 40?.For peak B the coherence is lower, but the wavelength shorter. We find R2 - 0 4, q - 120,a --37, Aa - 320.The interpretation <strong>of</strong> beam widening <strong>from</strong> a single pair <strong>of</strong> instruments is rather hazardous.Loss <strong>of</strong> coherence can be due to many different circumstances: instrumental noise, faultyrecording, clock errors, and lack <strong>of</strong> stationarity (such as the variation in depth during a tidalcycle). In this sense the beam width inferred here must be regarded as an upper limit.In any case a rather better understanding <strong>of</strong> the wave system is reached by considering allthree instruments.(e) Di'spersionComparison <strong>of</strong> the spectra <strong>of</strong> three successive days shows a progressive shift <strong>of</strong> the peakstoward high frequencies (figure 5). The frequency <strong>of</strong> peak A increases by 5 c/ks in a day;peak B increases by 8 c/ks per day. This progressive increase in frequency is characteristic<strong>of</strong> all records. On figure 17 peaks A and B appear as slanting ridges on a contour chart <strong>of</strong>spectral density as a function <strong>of</strong> frequency and time. The two ridges slant at different anglesand intersect on 30 October. The ridges are found to be remarkably straight, so that df/dtis nearly constant for any one ridge.The ridges can be accounted for in terms <strong>of</strong> classical wave theory. Let x be the distance<strong>from</strong> a source to a recorder, to, the time <strong>of</strong> generation, and t, the time <strong>of</strong> recording. The sourceis assumed a point in space-time. This implies that linear dimensions are small compared totravel distances, and duration small compared to travel time.The group velocity, V(f), is the speed with which some frequencyf, is propagated <strong>from</strong>source to receiver: V(f) x/(t- to). (5.4)In deep water V(f) = g/47af. (5.5)It follows that f g(t -to) /4irx, (5.6)so that on a plot <strong>of</strong>f against t a single event lies along a straight line with slopedf/dt - g/47Tx.The intercepts withf 0 occurs at t = to. Each <strong>of</strong> the ridge lines can then be immediatelyassociated with a source <strong>of</strong> known time and distance. For peaks A and B the results are:A: to = 2300 P.D.T. on 22 October, A = 590, 0 2450 T,B:to 1200P.D.T.onl8October, A 960, 0 1950T.Here A is the distance expressed in terms <strong>of</strong> the angle subtended at the earth's centre betweensource and receiver. The directions and widths <strong>of</strong> the sources have previously been estimated.Evidently the two storms are located in widely different areas <strong>of</strong> the Pacific Ocean.
- Page 1 and 2: Directional Recording of Swell from
- Page 3 and 4: 506 W. H. MUNK, G. R. MILLER, F. E.
- Page 5 and 6: 508 W. H. MUNK, G. R. MILLER, F. E.
- Page 7 and 8: 510 W. H. MUNK, G. R. MILLER, F. E.
- Page 9 and 10: 512 W. H. MUNK, G. R. MILLER, F. E.
- Page 11 and 12: 514 W. H. MUNK, G. R. MILLER, F. E.
- Page 13: 516 W. H. MUNK, G. R. MILLER, F. E.
- Page 17 and 18: 520 W. H. MUNK, G. R. MILLER, F. E.
- Page 19 and 20: 522 W. H. MUNK, G. R. MILLER, F. E.
- Page 21 and 22: 524 W. H. MUNK, G. R. MILLER, F. E.
- Page 23 and 24: 526 W. H. MUNK, G. R. MILLER, F. E.
- Page 25 and 26: 528 W. H-. MUNK, G. R. MILLER, F. E
- Page 27 and 28: 530 W. H. MUNK, G. R. MILLER, F. E.
- Page 29 and 30: 532 W. H. MUNK, G. R. MILLER, F. E.
- Page 31 and 32: 534 W. H. MUNK, G. R. MILLER, F. E.
- Page 33 and 34: 00207'-0.C-0-01~~~~~~~~~~~~~~~~~~~~
- Page 35 and 36: 538714Cld0,9~~~~~~~U0CldCIO.0a.)a.)
- Page 37 and 38: 540 W. H. MUNK, G. R. MILLER, F. E.
- Page 39 and 40: 542 W. H. MUNK, G. R. MILLER, F. E.
- Page 41 and 42: 544 W. H. MUNK, G. R. MILLER, F. E.
- Page 43 and 44: 546 W. H. MUNK, G. R. MILLER, F. E.
- Page 45 and 46: 548 W. H. MUNK, G. R. MILLER, F. E.
- Page 47 and 48: 550 W. H. MUNK, G. R. MILLER, F. E.
- Page 49 and 50: 140? 1300 1200 1100 1000 900 80016t
- Page 51 and 52: ;554 W. H. MUNK, G. R. MILLER, F. E
- Page 53 and 54: 556 W. H. MUNK, G. R. MILLER, F. E.
- Page 55 and 56: 558 W. H. MUNK, G. R. MILLER, F. E.
- Page 57 and 58: 560 W. H. MUNK, G. R. MILLER, F. E.
- Page 59 and 60: 562 W. H. MUNK, G. R. MILLER, F. E.
- Page 61 and 62: 564 W. H. MUNK, G. R. MILLER, F. E.
- Page 63 and 64: 566 W. H. MUNK, G. R. MILLER, F. E.
- Page 65 and 66:
568 W. H. MUNK, G. R. MILLER, F. E.
- Page 67 and 68:
570 W. H. MUNK, G. R. MILLER, F. E.
- Page 69 and 70:
572 W. H. MUNK, G. R. MILLER, F. E.
- Page 71 and 72:
574 W. H. MUNK, G. R. MILLER, F. E.
- Page 73 and 74:
576 W. H. MUNK, G. R. MILLER, F. E.
- Page 75:
578 W. H. MUNK, G. R. MILLER, F. E.
- Page 78 and 79:
Munk et al. Phil. Trans A, volume 2
- Page 80 and 81:
582 W. H. MUNK, G. R. MILLER, F. E.
- Page 82:
584 W. H. MUNK, G. R. MILLER, F. E.