Directional Recording of Swell from Distant Storms - Department of ...
Directional Recording of Swell from Distant Storms - Department of ...
Directional Recording of Swell from Distant Storms - Department of ...

You also want an ePaper? Increase the reach of your titles
YUMPU automatically turns print PDFs into web optimized ePapers that Google loves.
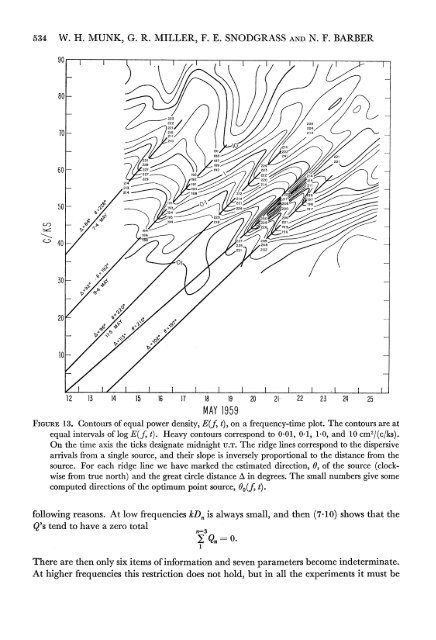
534 W. H. MUNK, G. R. MILLER, F. E. SNODGRASS AND N. F. BARBER80TO.70 - 214 (11214 188 212~~~~~~~~~~~~~~~~~~01191 221~~~~~19 22193~~~~~~~~~~~~~~~~~~~~~~~~1221121912 13 14 15 16 IT 18 19 20 24 21 22 23 24MAY 1959FIGURE 13. Contours <strong>of</strong> equal power density, E(f, t), on a frequency-time plot. The contours are atequal intervals <strong>of</strong> log E(fJ, t). Heavy contours correspond to 0 01, 0-1, 10, and 10 cm2/(c/ks).On the time axis the ticks designate midnight U.T. The ridge lines correspond to the dispersivearrivals <strong>from</strong> a single source, and their slope is inversely proportional to the distance <strong>from</strong> thesource. For each ridge line we have marked the estimated direction, 0, <strong>of</strong> the source (clockwise<strong>from</strong> true north) and the great circle distance A in degrees. The small numbers give somecomputed directions <strong>of</strong> the optimum point source, 00(f, t).following reasons. At low frequencies kDn is always small, and then (7.10) shows that theQ's tend to have a zero totaln=There are then only six items <strong>of</strong> information and seven parameters become indeterminate.At higher frequencies this restriction does not hold, but in all the experiments it must be