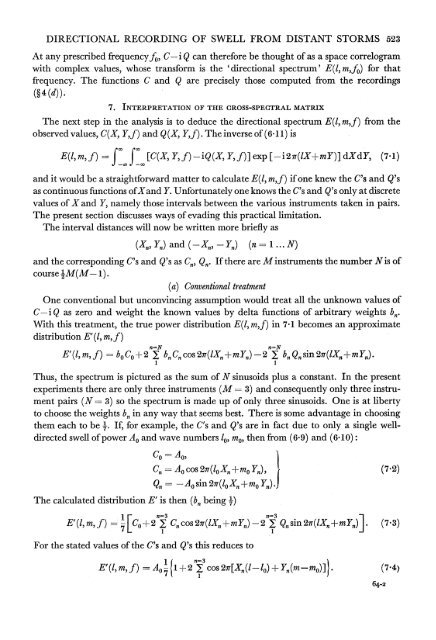
DIRECTIONAL RECORDING OF SWELL FROM DISTANT STORMS 523At any prescribed frequencyfo, C-i Q can therefore be thought <strong>of</strong> as a space correlogramwith complex values, whose transform is the 'directional spectrum' E(l,m,fo) for thatfrequency. The functions C and Q are precisely those computed <strong>from</strong> the recordings(?4(d)).7. INTERPRETATION OF THE CROSS-SPECTRAL MATRIXThe next step in the analysis is to deduce the directional spectrum E(l, mf) <strong>from</strong> theobserved values, C(X, Y,f) and Q (X, Y,f). The inverse <strong>of</strong> (6.1 1) isE(l, m, f) = f _00 _00j'0 [C(X, Y,f) -iQ(X, Y,f)] exp [-i2nff(lX+mY)] dXdY, (7.1)and it would be a straightforward matter to calculate E(l, m,f) if one knew the C's and Q'sas continuous functions <strong>of</strong>Xand Y. Unfortunately one knows the C's and Q's only at discretevalues <strong>of</strong> X and Y, namely those intervals between the various instruments taken in pairs.The present section discusses ways <strong>of</strong> evading this practical limitation.The interval distances will now be written more briefly as(X., Yn) and (- Xn, -Y) (n = 1 ... N)and the corresponding C's and Q's as Cn, Qn. If there are M instruments the number Nis <strong>of</strong>course 'M(M- 1).(a) Conventional treatmentOne conventional but unconvincing assumption would treat all the unknown values <strong>of</strong>C -i Q as zero and weight the known values by delta functions <strong>of</strong> arbitrary weights bn.With this treatment, the true power distribution E(l, m,f) in 7-1 becomes an approximatedistribution E'(l, m,f)n=NE'(l, m, f)-bo Co + 2 bn Cn cos 2ir(lXn + m Y) 2 E bn Qn sin 2ir(lXn + mYn).1 1Thus, the spectrum is pictured as the sum <strong>of</strong> N sinusoids plus a constant. In the presentexperiments there are only three instruments (M 3) and consequently only three instrumentpairs (N 1 3) so the spectrum is made up <strong>of</strong> only three sinusoids. One is at libertyto choose the weights bn in any way that seems best. There is some advantage in choosingthem each to be -1. If, for example, the C's and Q's are in fact due to only a single welldirectedswell <strong>of</strong> power Ao and wave numbers 1, mo, then <strong>from</strong> (6 9) and (6.10):n-NCo. - AO)A.~~~~~~~72Cn AO cos 2ir(10 Xn + mO Yn), (7(2)QnAO sin 2ir(10 Xn + m0 Yn).JThe calculated distribution E' is then (bn being .)1r 7n-3 n=3E'(1, m f) = 7IC0?2 E Cn cos 2r(1Xn + m YJ )-2 I Qn sin 2nr(IX7?mY3)I . (7.3)For the stated values <strong>of</strong> the C's and 9's this reduces toE' (l, m,fE) = A4 ( 1 +2 Ecos 2X77[3(l-10) + Y73(m-mo)]}) (7.4)64-2
524 W. H. MUNK, G. R. MILLER, F. E. SNODG:RASS AND N. F. BARBERThe maximum value <strong>of</strong> this occurs at 10, mo and is numerically equal to AO, the actualpower <strong>of</strong> the swell. The choice <strong>of</strong> the b's as 71 has brought this about. But this does not preventthe spectrum E' <strong>from</strong> extending repetitively to indefinitely large wave numbers. Thisunconvincing result arises <strong>from</strong> the unconvincing assumption made at the start.(b) A best-fitting single wave trainFor local geophysical reasons one may expect to receive mainly well-directed swells<strong>from</strong> distant storms. A reasonable treatment would be to fit the measured C's and Q'sas well as possible in a least-square error sense by one or more such wave trains. Now asingle wave train <strong>of</strong> power AO) wave numbers, 10, mo, would give the C's and Q's listed in(7.2), and these imply perfect coherence, which is never observed experimentally. But onemay note that the sum <strong>of</strong> the squares <strong>of</strong> the differences between the observed C's and Q'sand those expected for a single wave train isn=3 n=3H- (CO-AO)2+2 E [Cn-AOcos21T(lOXn+mO Y)]2+2 I [Qn+AOsin2ff(l0Xn+mO Y)]21 1n-3-C02 + 2 E (Cn2 + Q2) + 7A2n-3 n-3-2AO [C0+2 i Cncos 2r(lO X + nmO Yn)-2 E Qnsin 21T(l0XXn+mO Yn)].We may chose AO, 10 and mo so as to minimize this squared error. The quantity in squarebrackets is merely seven times E'(l1, mo,f0), the power density that would be predicted <strong>from</strong>the observed C's and Q's for wave numbers 10, mo by the conventional treatment <strong>of</strong> (7.3).The choice <strong>of</strong> A0 that minimizes H is seen to beA0 = El (l, mi0,f0). (7.5)n=3Then H= C+2 E (C2+Q2)-7 [E'(0,m0,f0)]2. (76)The choice <strong>of</strong> l0 MO' that minimizes H and so represents a 'best fitting' wave train is merelythat which makes [E'(l0, m0,f0)]2 as great as possible.- So the conventional treatment is useful after all. The indicated procedure is as follows:Compute E'(l, m,) according to (7.3), using the observed seven quantities Cn, Qn and usingtrial values for 1, m. The particular values, lo) MO, for which [E'(l, if)]2 is greatest definethe best fitting single wave train in the least-square sense; and the corresponding valueE'(l1, mo,f) is the power <strong>of</strong> the wave train. In making this choice one, <strong>of</strong> course, ignoresany 1, m values for which E' proves to be negative.An example is shown in figure 8. Writing I k sin a, m i k cos a, we have chosen variousvalues <strong>of</strong> k in the vicinity <strong>of</strong> the theoretical value <strong>of</strong> k at the frequency under consideration.For each trial value <strong>of</strong> k we computed H(k, a) for various a, and determined its minimumvalue, Hmin. (k), corresponding to a- a. The curve Hmin. (k) has a minimum at some valuek - k. In the example shown the value <strong>of</strong> ko does not differ measurably <strong>from</strong> ktheo.Furthermore, values <strong>of</strong> a0 remained unchanged throughout the interval here under con-sideration. This is essentially the result <strong>of</strong> many other such determinations; k remains closeto ktheory throughout the frequencies <strong>of</strong> the sea and swell. At the very low frequencies the
- Page 1 and 2: Directional Recording of Swell from
- Page 3 and 4: 506 W. H. MUNK, G. R. MILLER, F. E.
- Page 5 and 6: 508 W. H. MUNK, G. R. MILLER, F. E.
- Page 7 and 8: 510 W. H. MUNK, G. R. MILLER, F. E.
- Page 9 and 10: 512 W. H. MUNK, G. R. MILLER, F. E.
- Page 11 and 12: 514 W. H. MUNK, G. R. MILLER, F. E.
- Page 13 and 14: 516 W. H. MUNK, G. R. MILLER, F. E.
- Page 15 and 16: 518 W. H. MUNK, G. R. MILLER, F. E.
- Page 17 and 18: 520 W. H. MUNK, G. R. MILLER, F. E.
- Page 19: 522 W. H. MUNK, G. R. MILLER, F. E.
- Page 23 and 24: 526 W. H. MUNK, G. R. MILLER, F. E.
- Page 25 and 26: 528 W. H-. MUNK, G. R. MILLER, F. E
- Page 27 and 28: 530 W. H. MUNK, G. R. MILLER, F. E.
- Page 29 and 30: 532 W. H. MUNK, G. R. MILLER, F. E.
- Page 31 and 32: 534 W. H. MUNK, G. R. MILLER, F. E.
- Page 33 and 34: 00207'-0.C-0-01~~~~~~~~~~~~~~~~~~~~
- Page 35 and 36: 538714Cld0,9~~~~~~~U0CldCIO.0a.)a.)
- Page 37 and 38: 540 W. H. MUNK, G. R. MILLER, F. E.
- Page 39 and 40: 542 W. H. MUNK, G. R. MILLER, F. E.
- Page 41 and 42: 544 W. H. MUNK, G. R. MILLER, F. E.
- Page 43 and 44: 546 W. H. MUNK, G. R. MILLER, F. E.
- Page 45 and 46: 548 W. H. MUNK, G. R. MILLER, F. E.
- Page 47 and 48: 550 W. H. MUNK, G. R. MILLER, F. E.
- Page 49 and 50: 140? 1300 1200 1100 1000 900 80016t
- Page 51 and 52: ;554 W. H. MUNK, G. R. MILLER, F. E
- Page 53 and 54: 556 W. H. MUNK, G. R. MILLER, F. E.
- Page 55 and 56: 558 W. H. MUNK, G. R. MILLER, F. E.
- Page 57 and 58: 560 W. H. MUNK, G. R. MILLER, F. E.
- Page 59 and 60: 562 W. H. MUNK, G. R. MILLER, F. E.
- Page 61 and 62: 564 W. H. MUNK, G. R. MILLER, F. E.
- Page 63 and 64: 566 W. H. MUNK, G. R. MILLER, F. E.
- Page 65 and 66: 568 W. H. MUNK, G. R. MILLER, F. E.
- Page 67 and 68: 570 W. H. MUNK, G. R. MILLER, F. E.
- Page 69 and 70: 572 W. H. MUNK, G. R. MILLER, F. E.
- Page 71 and 72:
574 W. H. MUNK, G. R. MILLER, F. E.
- Page 73 and 74:
576 W. H. MUNK, G. R. MILLER, F. E.
- Page 75:
578 W. H. MUNK, G. R. MILLER, F. E.
- Page 78 and 79:
Munk et al. Phil. Trans A, volume 2
- Page 80 and 81:
582 W. H. MUNK, G. R. MILLER, F. E.
- Page 82:
584 W. H. MUNK, G. R. MILLER, F. E.