Directional Recording of Swell from Distant Storms - Department of ...
Directional Recording of Swell from Distant Storms - Department of ...
Directional Recording of Swell from Distant Storms - Department of ...

Create successful ePaper yourself
Turn your PDF publications into a flip-book with our unique Google optimized e-Paper software.
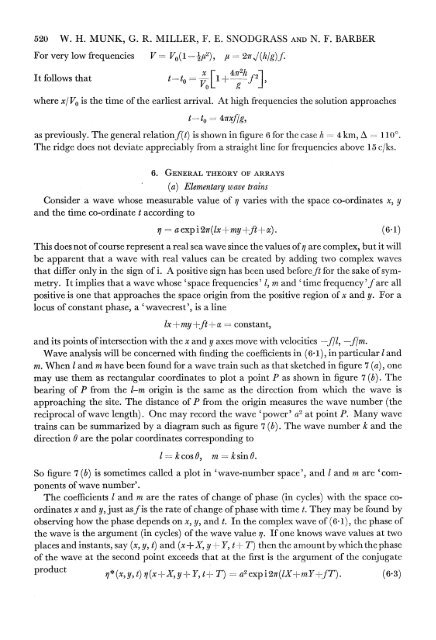
520 W. H. MUNK, G. R. MILLER, F. E. SNODGRASS AND N. F. BARBERFor very low frequencies V- V0(1--2u2), ji 2= f(h/g)fIt follows that t-to - [ + 7rhf0]where x/VO is the time <strong>of</strong> the earliest arrival. At high frequencies the solution approachestto = 4irxf/g,as previously. The general relationf(t) is shown in figure 6 for the case h -- 4 km, A == 1 IO'.The ridge does not deviate appreciably <strong>from</strong> a straight line for frequencies above 15 c/ks.6. GENERAL THEORY OF ARRAYS(a) Elementary wave trainsConsider a wave whose measurable value <strong>of</strong> q varies with the space co-ordinates x, yand the time co-ordinate t according tov = a exp'i 2nr(lx + my -ft + a). (6.1)This does not <strong>of</strong> course represent a real sea wave since the values <strong>of</strong> a are complex, but'it willbe apparent that a wave with real values can be created by adding two complex wavesthat differ only in the sign <strong>of</strong> i. A positive sign has been used beforeft for the sake <strong>of</strong> symmetry.It implies that a wave whose 'space frequencies' 1, m and 'time frequency 'fare allpositive is one that approaches the space origin <strong>from</strong> the positive region <strong>of</strong> x and y. For alocus <strong>of</strong> constant phase, a 'wavecrest', is a lineIx + my +ft - a = constant,and its points <strong>of</strong> intersection with the x and y axes move with velocities -fi, -flm.Wave analysis will be concerned with finding the coefficients in (6. 1), in particular I andm. When I and m have been found for a wave train such as that sketched in figure 7 (a), onemay use them as rectangular coordinates to plot a point P as shown in figure 7 (b). Thebearing <strong>of</strong> P <strong>from</strong> the 1-m origin is the same as the direction <strong>from</strong> which the wave isapproaching the site. The distance <strong>of</strong> P <strong>from</strong> the origin measures the wave number (thereciprocal <strong>of</strong> wave length). One may record the wave 'power' a2 at point P. Many wavetrains can be summarized by a diagram such as figure 7 (b). The wave number k and thedirection 0 are the polar coordinates corresponding to1z=kcosO,m-ksinO.So figure 7 (b) is sometimes called a plot in 'wave-number space', and I and m are 'components<strong>of</strong> wave number'.The coefficients I and m are the rates <strong>of</strong> change <strong>of</strong> phase (in cycles) with the space coordinatesx and y, just asf is the rate <strong>of</strong> change <strong>of</strong> phase with time t. They may be found byobserving how the phase depends on x, y, and t. In the complex wave <strong>of</strong> (6.1), the phase <strong>of</strong>the wave is the argument (in cycles) <strong>of</strong> the wave value q. If one knows wave values at twoplaces and instants, say (x, y, t) and (x +X, y -1- Y, tA-- T) then the amount by which the phase<strong>of</strong> the wave at the second point exceeds that at the first is the argument <strong>of</strong> the conjugateproduct n* (x,y,t)n(x-l-X,y+rY,t-1-T) =a2expi2ir(lX-1-mY?4fT). (6.3)