Directional Recording of Swell from Distant Storms - Department of ...
Directional Recording of Swell from Distant Storms - Department of ...
Directional Recording of Swell from Distant Storms - Department of ...

You also want an ePaper? Increase the reach of your titles
YUMPU automatically turns print PDFs into web optimized ePapers that Google loves.
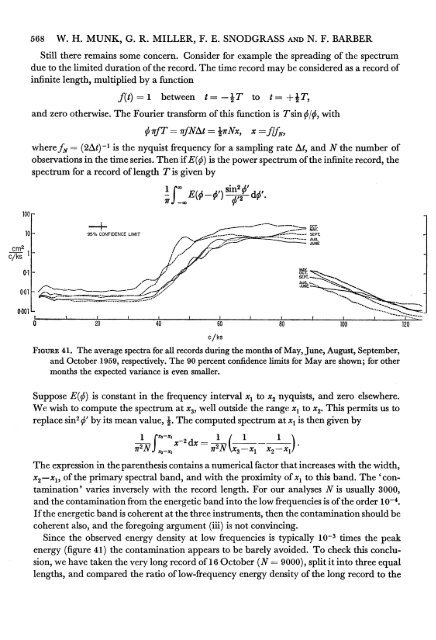
568 W. H. MUNK, G. R. MILLER, F. E. SNODGRASS AND N. F. BARBERStill there remains some concern. Consider for example the spreading <strong>of</strong> the spectrumdue to the limited duration <strong>of</strong> the record. The time record may be considered as a record <strong>of</strong>infinite length, multiplied by a functionf(t) = 1 between t= --IT to t= +IT,and zero otherwise. The Fourier transform <strong>of</strong> this function is Tsin q/qS, with0 iTf T - afNAt - jiTNx, X =f/1fNwherefN = (2At) -I is the nyquist frequency for a sampling rate At, and N the number <strong>of</strong>observations in the time series. Then if E(0) is the power spectrum <strong>of</strong> the infinite record, thespectrum for a record <strong>of</strong> length T is given by|E(o6-so)12n, -do100_-- X _- - - - - - ~~~~~~~~~~~~~~~~~~~~~OCT_,_=MAY.10- 95% CONFIDENCE LIMIT - - SEPT.............AUG.012 lJUNE010.01 ';-~2z~----..2z-:-T---zzr.~. -0001 L -I~~~~~~~~~~~~~~~~~~~~~~~~~~~~~~~~~AUG....* 7 E ...... - * ~~~~~~~~~~~~~~~~~~~~0 20 40 60 80 100 120c/ksFIGURE 41. The average spectra for all records during the months <strong>of</strong> May, June, August, September,and October 1959, respectively. The 90 percent confidence limits for May are shown; for othermonths the expected variance is even smaller.Suppose E(0) is constant in the frequency interval xi to x2 nyquists, and zero elsewhere.We wish to compute the spectrum at X3, well outside the range xl to x2. This permits us toreplace sin2 b' by its mean value, j. The computed spectrum at xi is then given by1 X'-XXI x-2dx= N( 1 I_ )T2NJX2_X17 X3-X1 X2-X1/The expression in the parenthesis contains a numerical factor that increases with the width,x2-xI, <strong>of</strong> the primary spectral band, and with the proximity <strong>of</strong> xl to this band. The 'contamination'varies inversely with the record length. For our analyses N is usually 3000,and the contamination <strong>from</strong> the energetic band into the low frequencies is <strong>of</strong> the order 10-4.If the energetic band is coherent at the three instruments, then the contamination should becoherent also, and the foregoing argument (iii) is not convincing.Since the observed energy density at low frequencies is typically 10- times the peakenergy (figure 41) the contamination appears to be barely avoided. To check this conclusion,we have taken the very long record <strong>of</strong> 16 October (N =9000), split it into three equallengths, and compared the ratio <strong>of</strong> low-frequency energy density <strong>of</strong> the long record to the