Chemical and toxicological properties of coal fly ash - University of ...
Chemical and toxicological properties of coal fly ash - University of ...
Chemical and toxicological properties of coal fly ash - University of ...
- No tags were found...
Create successful ePaper yourself
Turn your PDF publications into a flip-book with our unique Google optimized e-Paper software.
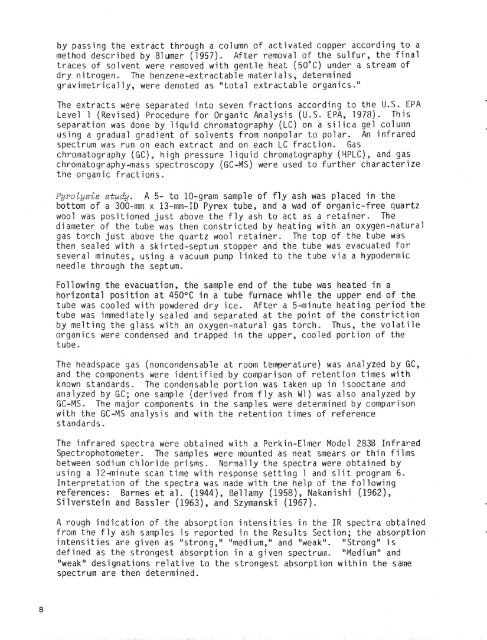
y passing the extract through a column <strong>of</strong> activated copper according to amethod described by Blumer (1957). After removal <strong>of</strong> the sulfur, the finaltraces <strong>of</strong> solvent were removed with gentle heat (50°C) under a stream <strong>of</strong>dry nitrogen. The benzene-extractable material s, determinedgravimetrically, were denoted as "total extractable organics."The extracts were separated into seven fractions according to the U.S. EPALevel 1 (Revised) Procedure for Organic Analysis (U.S. €PA, 1978). Thisseparation was done by liquid chromatography (LC) on a silica gel coluinnusing a gradual gradient <strong>of</strong> solvents from nonpolar to polar. An infraredspectrum was run on each extract <strong>and</strong> on each LC fraction. Gaschromatography (GC) , high pressure 1 i quid chromatography (YPLC) , <strong>and</strong> gaschromatography-mass spectroscopy (GC-MS) were used to further characterizethe organic fractions.PyroZysis study. A 5- to 10-gram sample <strong>of</strong> <strong>fly</strong> <strong>ash</strong> was placed in thebottom <strong>of</strong> a 300-mm x 13-mm-ID Pyrex tube, <strong>and</strong> a wad <strong>of</strong> organic-free quartzwool was positioned just above the <strong>fly</strong> <strong>ash</strong> to act as a retainer. Thediameter <strong>of</strong> the tube was then constricted by heating with an oxygen-naturalgas torch just above the quartz wool retainer. The top <strong>of</strong> the tube wasthen sealed with a skirted-septum stopper <strong>and</strong> the tube was evacuated forseveral minutes, using a vacuum pump linked to the tube via a hypodermicneedle through the septum.Following the evacuation, the sample end <strong>of</strong> the tube was heated in ahorizontal position at 450°C in a tube furnace while the upper end <strong>of</strong> thetube was cooled with powdered dry ice. After a 5minute heating period thetube was immediately sealed <strong>and</strong> separated at the point <strong>of</strong> the constrictionby melting the glass with an oxygen-natural gas torch. Thus, the volatileorganics were condensed <strong>and</strong> trapped in the upper, cooled portion <strong>of</strong> thetube.The headspace gas (noncondensable at room temperature) was analyzed by GC,<strong>and</strong> the components were identified by comparison <strong>of</strong> retention times withknown st<strong>and</strong>ards. The condensable portion was taken up in isooctane <strong>and</strong>analyzed by GC; one sample (derived from <strong>fly</strong> <strong>ash</strong> W1) was also analyzed byGC-MS. The major components in the samples were deterained by comparisonwith the GC-MS analysis <strong>and</strong> with the retention times <strong>of</strong> referencest<strong>and</strong>ards.The infrared spectra were obtained with a Perkin-Elmer Model 283B InfraredSpectrophotometer. The samples were mounted as neat smears or thin filmsbetween sodium chloride prisms. Normally the spectra were obtained byusing a 12-minute scan time with response setting 1 <strong>and</strong> slit program 6.Interpretation <strong>of</strong> the spectra was made with the help <strong>of</strong> the followingreferences: Barnes et ale (l944), Be1 lamy (l958), Nakanishi (l962),Si lverstein <strong>and</strong> Bassler (l963), <strong>and</strong> Szymanski (1967).A rough indication <strong>of</strong> the absorption intensities in the IR spectra obtainedfrom the <strong>fly</strong> <strong>ash</strong> samples is reported in the Results Section; the absorptionintensities are given as "strong," "medi um," <strong>and</strong> "weak". "Strong" isdefined as the strongest absorption in a given spectrum. "Medium" <strong>and</strong>"weak" designations relative to the strongest absorption within the samespectrum are then determined.


