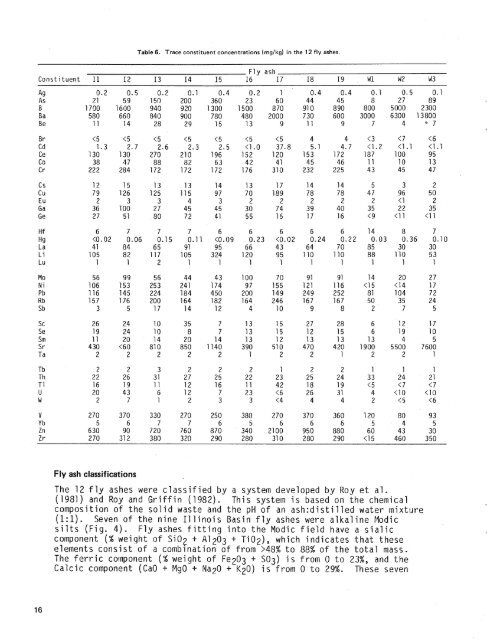
Table 6. Sulfur species in the 12 <strong>fly</strong> <strong>ash</strong>es (percent weight).Fly <strong>ash</strong> Sulfate S Sulfide S Total S<strong>ash</strong>es were also characterized by greater amounts <strong>of</strong> Na, Ba, <strong>and</strong> Sr, whileA1 <strong>and</strong> Fe were lower as compared with the amounts in the Illinois Basinsamples. These findings are similar to those reported in the <strong>coal</strong> <strong>and</strong> <strong>fly</strong><strong>ash</strong> literature, in which higher levels <strong>of</strong> Ba, Ca, Mg, Na, <strong>and</strong> Sr have beengeneral ly associated with western l ignite <strong>coal</strong> s ( Abernathy, 1969; Furr etal., 1977; Gluskoter et al., 1977; <strong>and</strong> Natusch et al., 1977).The specific gravities reported in Table 2 for the Illinois Basin <strong>fly</strong> <strong>ash</strong>esare close to the specific gravity <strong>of</strong> pure quartz (GO2), which is 2.65.The higher specific gravities <strong>of</strong> the two lignite <strong>fly</strong> <strong>ash</strong>es W2 (3.0) <strong>and</strong> W3(3.1) were probably due to the low carbon content (Table 4) <strong>and</strong> thedominant mineral s--periclase (MgO), with a density <strong>of</strong> 3.58 <strong>and</strong> anhydri te(C~SO~), at about 2.92.The trace constituent concentrations in the <strong>fly</strong> <strong>ash</strong>es (Table 6) wereextremely variable. Arsenic in the I1 linoi s Basin samples (11-19) rangedfrom 21 to 360 mg/kg; Co varied from 38 to 88 mg/kg. Zinc was the mostvariable, ranging from 90 to 2,100 mg/kg. In spite <strong>of</strong> the variable nature<strong>of</strong> <strong>fly</strong> <strong>ash</strong>, the Illinois Basin samples can be broadly characterized <strong>ash</strong>aving greater trace constituent concentrations than the three westernsamples have. These trace constituents are (in order <strong>of</strong> decreasing averageconcentrations in the solid) Zn, Ni, Rb, Cs, Cr, Co, U, Ge, Mo, V, Li, Cd,TI, Sm, Pb, Be, Eu, Tb, Ga, Ce, As, Cu, Lu, <strong>and</strong> Sc. Many<strong>of</strong> theseelementshave been cited in the literature as generally occurring in greaterconcentrations in eastern Paleozoic <strong>coal</strong>s <strong>and</strong> their <strong>ash</strong>es than in western<strong>coal</strong>s <strong>of</strong> Mesozoic <strong>and</strong> Terti ary-age (Abernathy, 1969; Gl uskoter et a1 . ,1977; Natusch et al., 1977; <strong>and</strong> Page et al., 1979). The averageconcentrations <strong>of</strong> Hf, Sb, Se, Ta, Th, W, <strong>and</strong> Yb in the <strong>fly</strong> <strong>ash</strong>es were notfound to correlate with <strong>coal</strong> type in this study.
Table 6. Trace constituent concentrations (rnglkg) in the 12 <strong>fly</strong> <strong>ash</strong>es.Fly <strong>ash</strong>Constituent I1 I2 I3 I4 I5 I6 I7 I8 19 W 1 N2 W3ly <strong>ash</strong> classif icatisnsThe 12 <strong>fly</strong> <strong>ash</strong>es were classified by a system developed by Roy et al.(1981) <strong>and</strong> Roy <strong>and</strong> Griffin (1982). This system is based on the chemicalcomposition <strong>of</strong> the solid waste <strong>and</strong> the pH <strong>of</strong> an askdistilled water mixture(I:) Seven <strong>of</strong> the nine Illinois Basin <strong>fly</strong> <strong>ash</strong>es were alkaline Modicsilts (Fig. 4). Fly <strong>ash</strong>es fitting into the Modic field have a sialiccornponent (% weight <strong>of</strong> Si02 + A1 203 + TiOz), which indicates that theseelements consist <strong>of</strong> a combination <strong>of</strong> from >48% to 88% <strong>of</strong> the total mass.The ferric cornponent (% weight <strong>of</strong> Fez03 + S03) is from 0 to 23%, <strong>and</strong> theCalcic component (CaO + MgO + Na?O + K20) is from 0 to 29%. These seven
- Page 1 and 2: lllinoiSTATSTAT
- Page 3 and 4: V SURVEYatural Resources Building60
- Page 5 and 6: TABLESSummary of the origin and gen
- Page 7 and 8: The overall purpose of this investi
- Page 9 and 10: steady state conditions in the disp
- Page 11 and 12: total carbon determinations were ca
- Page 13 and 14: y passing the extract through a col
- Page 15 and 16: The GC-MS analyses were performed b
- Page 17 and 18: with ultrapure water. The final HCl
- Page 19: Be 3. Wlir~eraiogical composi'tion
- Page 23 and 24: Table 7. Fly ash sample classificat
- Page 25 and 26: Table 8. Carbon, sulfur, and benzen
- Page 27 and 28: Wave number (cm-'Figure 8. Infrared
- Page 29 and 30: Figure 12. HPLC chromatogram of the
- Page 31 and 32: Figure 16. HPLC chromatogram of the
- Page 34 and 35: Table 11. Organic components in the
- Page 36 and 37: Figure 21. Gas chromatogram of the
- Page 38 and 39: 4.Jrcrm c o mQU"* 'tn U.a-U U O NrO
- Page 40 and 41: constituents. The amount of soluble
- Page 42 and 43: Table 14. Change in chemical compos
- Page 44 and 45: Table 16. Change in chemical compos
- Page 46 and 47: Change in chemical composition as a
- Page 48 and 49: Figure 26. Changes in the concentra
- Page 50 and 51: Table 19. Corytituents in the long-
- Page 52 and 53: Table 21. The LC-50 values, amount
- Page 54 and 55: Table 23. The range of concentratio
- Page 56 and 57: Table 25. The range of concentratio
- Page 58 and 59: Table 27. The mean initial lengths
- Page 60 and 61: Table 32. The mean final lengths an
- Page 62 and 63: Several of the extrbivalves ( ~ are
- Page 64 and 65: The mean concentrations of various
- Page 66 and 67: 1972). Cadmium is a dangerous cumul
- Page 68 and 69: Bl umer, M., 1957, Removal of eleme
- Page 70 and 71:
Furr, A. K-, T. F, Parkinson, R. A.
- Page 72 and 73:
Murtha, M. J., and G. Burnet, 1979,
- Page 74 and 75:
Standard methods for examination of