Chemical and toxicological properties of coal fly ash - University of ...
Chemical and toxicological properties of coal fly ash - University of ...
Chemical and toxicological properties of coal fly ash - University of ...
- No tags were found...

You also want an ePaper? Increase the reach of your titles
YUMPU automatically turns print PDFs into web optimized ePapers that Google loves.
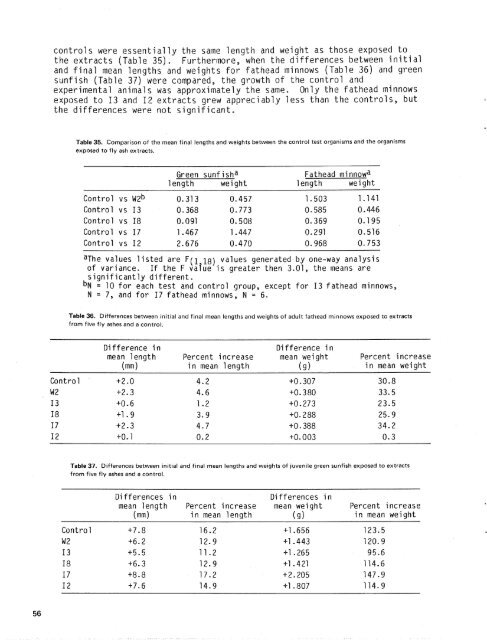
controls were essentially the same length <strong>and</strong> weight as those exposed tothe extracts (Table 35). Furthermore, when the differences between i niti a1<strong>and</strong> final mean lengths <strong>and</strong> weights for fathead minnows (Table 36) <strong>and</strong> greensunfish (Table 37) were compared, the growth <strong>of</strong> the control <strong>and</strong>experimental animals was approximately the same. Only the fathead minnowsexposed to I3 <strong>and</strong> I2 extracts grew appreciably less than the controls, butthe differences were not significant.Table 35. Comparison <strong>of</strong> the mean final lengths <strong>and</strong> weights between the control test organisms <strong>and</strong> the organismsexposed to <strong>fly</strong> <strong>ash</strong> extracts.Green sunfishaFathead minnowa1 ength weight length weightControl vs ~ 2 b 0.31 3 0.457 1.503 1 .I41Control vs I3 0.368 0.773 0.585 0.446Control vs I8 0.091 0. 508 0.369 0.195Control vs 17 1.467 1.447 0.291 0-516Control vs I2 2.676 0.470 0.968 0.753aThe values listed are F(1 18) values generated by one-way analysis<strong>of</strong> variance. If the F value is greater then 3.01, the means aresignificantly different.b~ = 10 for each test <strong>and</strong> control group, except for I3 fathead minnows,N = 7, <strong>and</strong> for I7 fathead minnows, N = 6.Table 36. Differences between initial <strong>and</strong> final mean lengths <strong>and</strong> weights <strong>of</strong> adult fathead minnows exposed to extractsfrom five <strong>fly</strong> <strong>ash</strong>es <strong>and</strong> a control.Control +2.0W2 +2.3I3 +0.6I8 +1.9I7 4-2.3I2 4-0. 1Di fference i nDifference inmean length Percent increase mean weight Percent increase(mm) in mean length (9) in mean weightTable 37. Differences between initial <strong>and</strong> final mean lengths <strong>and</strong> weights <strong>of</strong> juvenile green sunfish exposed to extractsfrom five <strong>fly</strong> <strong>ash</strong>es <strong>and</strong> a control.Di fferences inDi ff erences i nmean length Percent increase mean weight Percent increase(mm) in mean length (9) in mean weightControl +7.8 16.2W2 +6.2 12.9I3 +5.5 11.2I8 +6.3 12.9I7 +8.8 17.2I2 +7.6 14.9