POWER SOLUTIONS
POWER SOLUTIONS
POWER SOLUTIONS

Create successful ePaper yourself
Turn your PDF publications into a flip-book with our unique Google optimized e-Paper software.
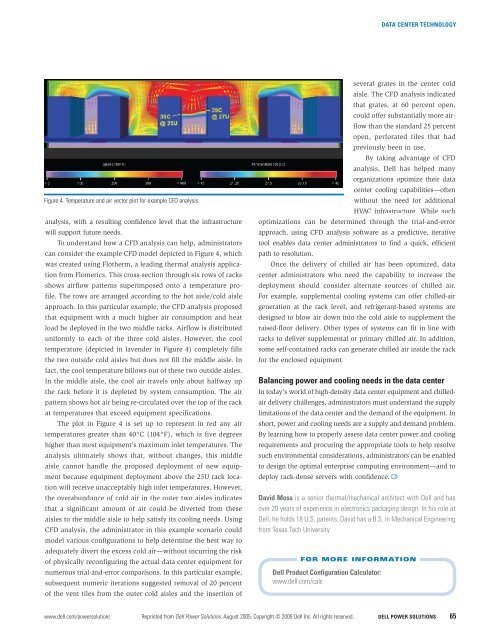
DATA CENTER TECHNOLOGYFigure 4. Temperature and air vector plot for example CFD analysisanalysis, with a resulting confidence level that the infrastructurewill support future needs.To understand how a CFD analysis can help, administratorscan consider the example CFD model depicted in Figure 4, whichwas created using Flotherm, a leading thermal analysis applicationfrom Flomerics. This cross-section through six rows of racksshows airflow patterns superimposed onto a temperature profile.The rows are arranged according to the hot aisle/cold aisleapproach. In this particular example, the CFD analysis proposedthat equipment with a much higher air consumption and heatload be deployed in the two middle racks. Airflow is distributeduniformly to each of the three cold aisles. However, the cooltemperature (depicted in lavender in Figure 4) completely fillsthe two outside cold aisles but does not fill the middle aisle. Infact, the cool temperature billows out of these two outside aisles.In the middle aisle, the cool air travels only about halfway upthe rack before it is depleted by system consumption. The airpattern shows hot air being re-circulated over the top of the rackat temperatures that exceed equipment specifications.The plot in Figure 4 is set up to represent in red any airtemperatures greater than 40°C (104°F), which is five degreeshigher than most equipment’s maximum inlet temperatures. Theanalysis ultimately shows that, without changes, this middleaisle cannot handle the proposed deployment of new equipmentbecause equipment deployment above the 25U rack locationwill receive unacceptably high inlet temperatures. However,the overabundance of cold air in the outer two aisles indicatesthat a significant amount of air could be diverted from theseaisles to the middle aisle to help satisfy its cooling needs. UsingCFD analysis, the administrator in this example scenario couldmodel various configurations to help determine the best way toadequately divert the excess cold air—without incurring the riskof physically reconfiguring the actual data center equipment fornumerous trial-and-error comparisons. In this particular example,subsequent numeric iterations suggested removal of 20 percentof the vent tiles from the outer cold aisles and the insertion ofseveral grates in the center coldaisle. The CFD analysis indicatedthat grates, at 60 percent open,could offer substantially more airflowthan the standard 25 percentopen, perforated tiles that hadpreviously been in use.By taking advantage of CFDanalysis, Dell has helped manyorganizations optimize their datacenter cooling capabilities—oftenwithout the need for additionalHVAC infrastructure. While suchoptimizations can be determined through the trial-and-errorapproach, using CFD analysis software as a predictive, iterativetool enables data center administrators to find a quick, efficientpath to resolution.Once the delivery of chilled air has been optimized, datacenter administrators who need the capability to increase thedeployment should consider alternate sources of chilled air.For example, supplemental cooling systems can offer chilled-airgeneration at the rack level, and refrigerant-based systems aredesigned to blow air down into the cold aisle to supplement theraised-floor delivery. Other types of systems can fit in line withracks to deliver supplemental or primary chilled air. In addition,some self-contained racks can generate chilled air inside the rackfor the enclosed equipment.Balancing power and cooling needs in the data centerIn today’s world of high-density data center equipment and chilledairdelivery challenges, administrators must understand the supplylimitations of the data center and the demand of the equipment. Inshort, power and cooling needs are a supply and demand problem.By learning how to properly assess data center power and coolingrequirements and procuring the appropriate tools to help resolvesuch environmental considerations, administrators can be enabledto design the optimal enterprise computing environment—and todeploy rack-dense servers with confidence.David Moss is a senior thermal/mechanical architect with Dell and hasover 20 years of experience in electronics packaging design. In his role atDell, he holds 18 U.S. patents. David has a B.S. in Mechanical Engineeringfrom Texas Tech University.FOR MORE INFORMATIONDell Product Configuration Calculator:www.dell.com/calcwww.dell.com/powersolutions Reprinted from Dell Power Solutions, August 2005. Copyright © 2005 Dell Inc. All rights reserved. DELL <strong>POWER</strong> <strong>SOLUTIONS</strong> 65