

Comprehensive Annual Financial Report - Metro Transit
Comprehensive Annual Financial Report - Metro Transit
Comprehensive Annual Financial Report - Metro Transit

You also want an ePaper? Increase the reach of your titles
YUMPU automatically turns print PDFs into web optimized ePapers that Google loves.
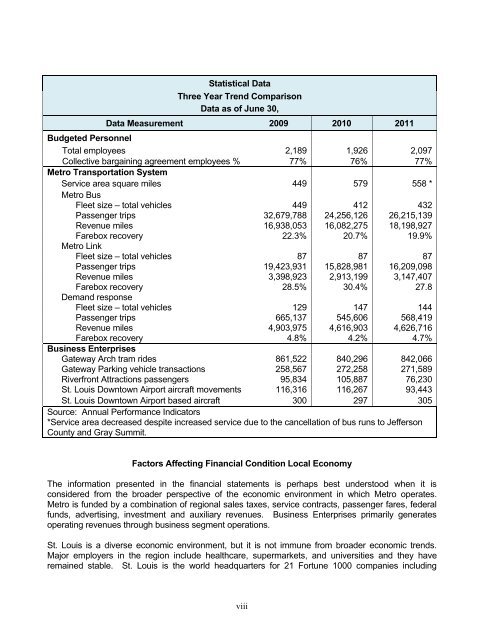
Statistical DataThree Year Trend ComparisonData as of June 30,Data Measurement 2009 2010 2011Budgeted PersonnelTotal employees 2,189 1,926 2,097Collective bargaining agreement employees % 77% 76% 77%<strong>Metro</strong> Transportation SystemService area square miles 449 579 558 *<strong>Metro</strong> BusFleet size – total vehicles 449 412 432Passenger trips 32,679,788 24,256,126 26,215,139Revenue miles 16,938,053 16,082,275 18,198,927Farebox recovery 22.3% 20.7% 19.9%<strong>Metro</strong> LinkFleet size – total vehicles 87 87 87Passenger trips 19,423,931 15,828,981 16,209,098Revenue miles 3,398,923 2,913,199 3,147,407Farebox recovery 28.5% 30.4% 27.8Demand responseFleet size – total vehicles 129 147 144Passenger trips 665,137 545,606 568,419Revenue miles 4,903,975 4,616,903 4,626,716Farebox recovery 4.8% 4.2% 4.7%Business EnterprisesGateway Arch tram rides 861,522 840,296 842,066Gateway Parking vehicle transactions 258,567 272,258 271,589Riverfront Attractions passengers 95,834 105,887 76,230St. Louis Downtown Airport aircraft movements 116,316 116,267 93,443St. Louis Downtown Airport based aircraft 300 297 305Source: <strong>Annual</strong> Performance Indicators*Service area decreased despite increased service due to the cancellation of bus runs to JeffersonCounty and Gray Summit.Factors Affecting <strong>Financial</strong> Condition Local EconomyThe information presented in the financial statements is perhaps best understood when it isconsidered from the broader perspective of the economic environment in which <strong>Metro</strong> operates.<strong>Metro</strong> is funded by a combination of regional sales taxes, service contracts, passenger fares, federalfunds, advertising, investment and auxiliary revenues. Business Enterprises primarily generatesoperating revenues through business segment operations.St. Louis is a diverse economic environment, but it is not immune from broader economic trends.Major employers in the region include healthcare, supermarkets, and universities and they haveremained stable. St. Louis is the world headquarters for 21 Fortune 1000 companies includingviii


