

Comprehensive Annual Financial Report - Metro Transit
Comprehensive Annual Financial Report - Metro Transit
Comprehensive Annual Financial Report - Metro Transit

Create successful ePaper yourself
Turn your PDF publications into a flip-book with our unique Google optimized e-Paper software.
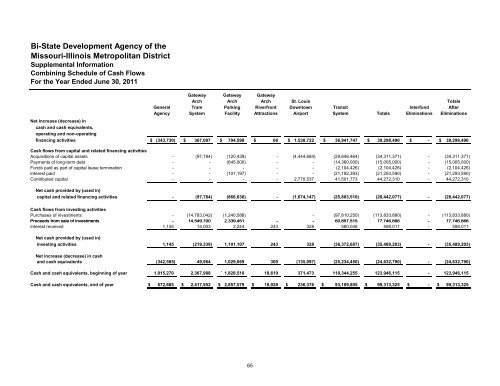
Bi-State Development Agency of theMissouri-Illinois <strong>Metro</strong>politan DistrictSupplemental InformationCombining Schedule of Cash FlowsFor the Year Ended June 30, 2011GeneralAgencyGatewayArchTramSystemGatewayArchParkingFacilityGatewayArchRiverfrontAttractionsSt. LouisDowntownAirport<strong>Transit</strong>SystemTotalsInterfundEliminationsTotalsAfterEliminationsNet increase (decrease) incash and cash equivalents,operating and non-operatingfinancing activities$(343,730)$367,087$794,598$66$ 1,538,722 $36,941,747 $39,298,490$-$39,298,490Cash flows from capital and related financing activitiesAcquisitions of capital assetsPayments of long-term debtFunds paid as part of capital lease terminationInterest paidContributed capital-----(97,784)----(120,439)(645,000)-(101,197)------(4,444,684)---2,770,537(29,648,464)(14,360,000)(2,104,426)(21,192,393)41,501,773(34,311,371)(15,005,000)(2,104,426)(21,293,590)44,272,310-----(34,311,371)(15,005,000)(2,104,426)(21,293,590)44,272,310Net cash provided by (used in)capital and related financing activities - (97,784) (866,636) - (1,674,147) (25,803,510) (28,442,077) - (28,442,077)Cash flows from investing activitiesPurchases of investmentsProceeds from sale of investmentsentInterest received--1,145(14,783,042)14,549,70014,003(1,240,588)2,339,4512,244-243--328(97,810,250)60,857,515515580,048(113,833,880)77,746,666746 666598,011---(113,833,880)77,746,666746 666598,011Net cash provided by (used in)investing activities 1,145 (219,339) 1,101,107 243 328 (36,372,687) (35,489,203) - (35,489,203)Net increase (decrease) in cashand cash equivalents (342,585) 49,964 1,029,069 309 (135,097) (25,234,450) (24,632,790) - (24,632,790)Cash and cash equivalents, beginning of year 1,015,270 2,367,988-1,828,510 18,619 371,473 118,344,255 123,946,115 - 123,946,115Cash and cash equivalents, end of year $ 672,685 $ 2,417,952 $ 2,857,579 $ 18,928 $ 236,376 $ 93,109,805 $ 99,313,325 $ - $ 99,313,32565


