

Comprehensive Annual Financial Report - Metro Transit
Comprehensive Annual Financial Report - Metro Transit
Comprehensive Annual Financial Report - Metro Transit

Create successful ePaper yourself
Turn your PDF publications into a flip-book with our unique Google optimized e-Paper software.
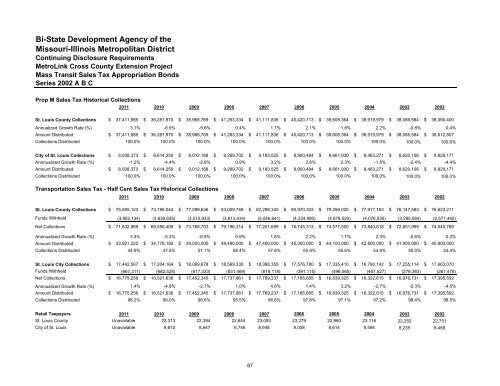
Bi-State Development Agency of theMissouri-Illinois <strong>Metro</strong>politan DistrictContinuing Disclosure Requirements<strong>Metro</strong>Link Cross County Extension ProjectMass <strong>Transit</strong> Sales Tax Appropriation BondsSeries 2002 A B CProp M Sales Tax Historical Collections2011 2010 2009 2008 2007 2006 2005 2004 2003 2002St. Louis County Collections $ 37,411,985 $ 36,281,970 $ 38,968,769 $ 41,263,334 $ 41,111,836 $ 40,420,713 $ 39,608,364 $ 38,919,979 $ 38,086,584 $ 38,390,400<strong>Annual</strong>ized Growth Rate (%) 3.1% -6.9% -5.6% 0.4% 1.7% 2.1% 1.8% 2.2% -0.8% 0.4%Amount Distributed $ 37,411,985 $ 36,281,970 $ 38,968,769 $ 41,263,334 $ 41,111,836 $ 40,420,713 $ 39,608,364 $ 38,919,979 $ 38,086,584 $ 38,612,807Collections Distributed 100.0% 100.0% 100.0% 100.0% 100.0% 100.0% 100.0% 100.0% 100.0% 100.6%City of St. Louis Collections $ 8,508,373 $ 8,614,250 $ 9,012,168 $ 9,269,702 $ 9,183,525 $ 8,900,484 $ 8,661,930 $ 8,463,271 $ 8,620,106 $ 8,829,171Annnualized Growth Rate (%) -1.2% -4.4% -2.8% 0.9% 3.2% 2.8% 2.3% -1.8% -2.4% -4.4%Amount Distributed $ 8,508,373 $ 8,614,250 $ 9,012,168 $ 9,269,702 $ 9,183,525 $ 8,900,484 $ 8,661,930 $ 8,463,271 $ 8,620,106 $ 8,829,171Collections Distributed 100.0% 100.0% 100.0% 100.0% 100.0% 100.0% 100.0% 100.0% 100.0% 100.0%Transportation Sales Tax - Half Cent Sales Tax Historical Collections2011 2010 2009 2008 2007 2006 2005 2004 2003 2002St. Louis County Collections $ 75,585,123 $ 73,196,044 $ 77,299,636 $ 83,009,748 $ 82,298,340 $ 80,970,303 $ 79,256,020 $ 77,917,153 $ 76,147,583 $ 76,623,211Funds Withheld (3,952,134) (3,639,635) (3,510,933) (3,813,434) (5,046,641) (4,224,990) (4,678,520) (4,076,535) (3,295,584) (2,577,442)Net Collections $ 71,632,989 $ 69,556,409 $ 73,788,703 $ 79,196,314 $ 77,251,699 $ 76,745,313 $ 74,577,500 $ 73,840,618 $ 72,851,999 $ 74,045,769Annnualized Growth Rate (%) 3.3% -5.3% -6.9% 0.9% 1.6% 2.2% 1.7% 2.3% -0.6% 0.2%Amount Distributed $ 33,921,222 $ 34,778,192 $ 39,500,000 $ 48,480,000 $ 47,400,000 $ 45,300,000 $ 44,100,000 $ 42,800,000 $ 41,900,000 $ 40,900,000Collections Distributed 44.9% 47.5% 51.1% 58.4% 57.6% 55.9% 55.6% 54.9% 55.0% 53.4%St. Louis City Collections $ 17,442,567 $ 17,204,164 $ 18,069,678 $ 18,569,330 $ 18,388,355 $ 17,576,780 $ 17,335,410 $ 16,790,142 $ 17,255,114 $ 17,663,070Funds Withheld (667,311) (682,528) (617,333) (831,469) (619,118) (391,115) (496,085) (467,527) (278,383) (267,478)Net Collections $ 16,775,256 $ 16,521,636 $ 17,452,345 $ 17,737,861 $ 17,769,237 $ 17,185,665 $ 16,839,325 $ 16,322,615 $ 16,976,731 $ 17,395,592Annnualized Growth Rate (%) 1.4% -4.8% -2.7% 1.0% 4.6% 1.4% 3.2% -2.7% -2.3% -4.5%Amount Distributed $ 16,775,256 $ 16,521,636 $ 17,452,345 $ 17,737,861 $ 17,769,237 $ 17,185,665 $ 16,839,325 $ 16,322,615 $ 16,976,731 $ 17,395,592Collections Distributed 96.2% 96.0% 96.6% 95.5% 96.6% 97.8% 97.1% 97.2% 98.4% 98.5%Retail Taxpayers 2011 2010 2009 2008 2007 2006 2005 2004 2003 2002St. Louis County Unavailable 22,313 22,394 22,644 23,093 23,279 22,960 23,116 22,252 22,751City of St. Louis Unavailable 8,610 8,647 8,746 8,948 9,008 8,614 8,594 8,235 8,46887


