

Comprehensive Annual Financial Report - Metro Transit
Comprehensive Annual Financial Report - Metro Transit
Comprehensive Annual Financial Report - Metro Transit

You also want an ePaper? Increase the reach of your titles
YUMPU automatically turns print PDFs into web optimized ePapers that Google loves.
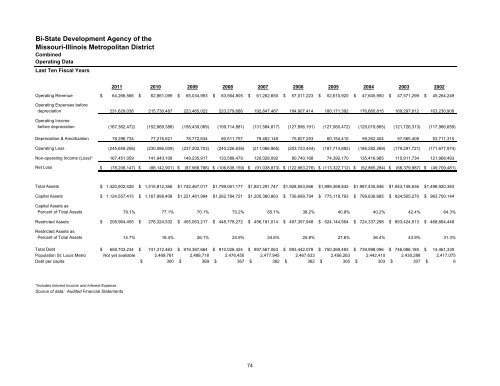
Bi-State Development Agency of theMissouri-Illinois <strong>Metro</strong>politan DistrictCombinedOperating DataLast Ten Fiscal Years2011 2010 2009 2008 2007 2006 2005 2004 2003 2002Operating Revenue $ 64,266,566 $ 62,861,099 $ 65,034,953 $ 63,564,805 $ 61,262,650 $ 57,011,223 $ 52,610,920 $ 47,645,950 $ 47,571,299 $ 45,264,249Operating Expenses beforedepreciation 231,629,038 215,730,487 223,465,022 223,279,686 192,847,467 184,907,414 180,171,392 176,665,815 169,297,612 163,230,908Operating Incomebefore depreciation (167,362,472) (152,869,388) (158,430,069) (159,714,881) (131,584,817) (127,896,191) (127,560,472) (129,019,865) (121,726,313) (117,966,659)Depreciation & Amortization 78,296,734 77,216,621 78,772,634 80,511,757 79,482,148 75,827,253 60,154,410 59,262,404 57,565,408 53,711,315Operating Loss (245,659,206) (230,086,009) (237,202,703) (240,226,638) (211,066,965) (203,723,444) (187,714,882) (188,282,269) (179,291,721) (171,677,974)Non-operating Income (Loss)* 167,451,059 141,943,108 149,235,917 133,588,479 120,028,092 80,740,168 74,392,170 135,416,985 110,911,734 121,968,493Net Loss $ (78,208,147) $ (88,142,901) $ (87,966,786) $ (106,638,159) $ (91,038,873) $ (122,983,276) $ (113,322,712) $ (52,865,284) $ (68,379,987) $ (49,709,481)Total Assets $ 1,420,902,428 $ 1,515,812,366 $ 1,742,467,017 $ 1,799,061,177 $ 1,851,291,747 $ 1,928,553,566 $ 1,899,368,842 $ 1,987,435,846 $ 1,943,148,636 $ 1,498,920,383Capital Assets $ 1,124,557,415 $ 1,167,998,408 $ 1,221,481,994 $ 1,262,784,721 $ 1,205,360,863 $ 736,699,794 $ 775,118,793 $ 799,636,685 $ 824,505,270 $ 963,700,144Capital Assets asPercent of Total Assets 79.1% 77.1% 70.1% 70.2% 65.1% 38.2% 40.8% 40.2% 42.4% 64.3%Restricted Assets $ 208,964,455 $ 278,324,532 $ 455,063,217 $ 448,778,272 $ 456,181,014 $ 497,357,948 $ 524,144,564 $ 724,337,298 $ 853,424,513 $ 468,664,448Restricted Assets asPercent of Total Assets 14.7% 18.4% 26.1% 24.9% 24.6% 25.8% 27.6% 36.4% 43.9% 31.3%Total Debt $ 658,703,234 $ 741,312,463 $ 919,387,664 $ 910,026,424 $ 897,567,063 $ 893,442,078 $ 750,369,483 $ 739,998,096 $ 746,086,185 $ 14,461,330Population St. Louis <strong>Metro</strong> Not yet available 2,469,761 2,488,718 2,476,450 2,477,945 2,467,633 2,456,263 2,442,410 2,430,288 2,417,075Debt per capita $ 300 $ 369 $ 367 $ 362 $ 362 $ 305 $ 303 $ 307 $ 6*Includes Interest Income and Interest ExpenseSource of data: Audited <strong>Financial</strong> Statements74


