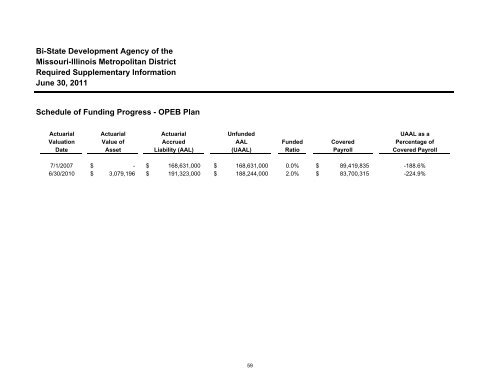
Bi-State Development Agency of theMissouri-Illinois <strong>Metro</strong>politan DistrictRequired Supplementary InformationJune 30, 2011Schedule of Funding Progress - OPEB PlanActuarialValuationDateActuarialValue ofAssetActuarialAccruedLiability (AAL)UnfundedAAL(UAAL)FundedRatioCoveredPayrollUAAL as aPercentage ofCovered Payroll7/1/20076/30/2010$ - $ 168,631,000$ 3,079,196 $ 191,323,000$$168,631,000188,244,0000.0%2.0%$$89,419,83583,700,315-188.6%-224.9%59
Bi-State Development Agency of theMissouri-Illinois <strong>Metro</strong>politan DistrictRequired Supplementary InformationJune 30, 2011Schedules of Funding Progress - Pension PlansActuarial Actuarial Accrued Unfunded UAAL as aActuarial Value of Liability (AAL) AAL Funded Covered Percentage ofValuation Asset =-Entry Age (UAAL) Ratio Payroll Covered PayrollDate (a) (b) (b – a) (a / b) (c) ((b – a) / c)Salaried Plan6/1/2005 $ 40,281,552 $ 39,850,200 $ (431,352) 101.1% $ 27,630,438 -1.6%6/1/2006 $ 42,880,931 $ 42,280,212 $ (600,719) 101.4% $ 25,601,698 -2.3%6/1/2007 $ 44,751,281 $ 43,192,896 $ (1,558,385) 103.6% $ 25,417,682 -6.1%6/1/2008 $ 47,677,929 $ 46,380,318 $ (1,297,611) 102.8% $ 25,645,092 -5.1%6/1/2009 $ 48,126,959 $ 47,280,017 $ (846,942) 101.8% $ 25,465,982 -3.3%6/1/2010 $ 47,226,544 $ 56,933,387 $ 9,706,843 83.0% $ 25,286,621 38.4%788 O&M Plan4/1/2005 $ 90,066,198 $ 138,783,821 $ 48,717,623 64.9% $ 48,808,651 99.8%4/1/2006 $ 94,032,935 $ 142,175,988 $ 48,143,053 66.1% $ 48,763,512 98.7%4/1/2007 $ 97,050,487 $ 151,535,366 $ 54,484,879 64.0% $ 49,474,125 110.1%4/1/2008 $ 99,123,171 $ 149,889,177 $ 50,766,006 66.1% $ 54,380,281 93.4%4/1/2009 $ 95,099,820 $ 154,636,364 $ 59,536,544 61.5% $ 52,442,843 113.5%4/1/2010 $ 93,422,609 $ 168,931,028 $ 75,508,419 55.3% $ 51,185,202 147.5%788 Clerical Plan4/1/2005 $ 6,503,985 $ 9,175,867 $ 2,671,882 70.9% $ 1,740,167 153.5%4/1/2006 $ 6,593,288 $ 9,266,506 $ 2,673,218 71.2% $ 1,747,260 153.0%4/1/2007 $ 6,652,726 $ 9,714,392 $ 3,061,666 68.5% $ 1,652,019 185.3%4/1/2008 $ 6,603,485 $ 9,995,819 $ 3,392,334 66.1% $ 1,702,916 199.2%4/1/2009 $ 6,117,313 $ 10,137,473 $ 4,020,160 60.3% $ 1,671,299 240.5%4/1/2010 $ 5,887,209 $ 10,601,527 $ 4,714,318 55.5% $ 1,632,280 288.8%IBEW Plan4/1/2005 $ 839,041 $ 1,634,761 $ 795,720 51.3% $ 2,001,896 39.7%4/1/2006 $ 924,183 $ 1,878,842 $ 954,659 49.2% $ 2,081,142 45.9%4/1/2007 $ 1,126,783 $ 1,787,944 $ 661,161 63.0% $ 2,512,973 26.3%4/1/2008 $ 1,407,149 $ 1,722,667 $ 315,518 81.7% $ 2,804,130 11.3%4/1/2009 $ 1,521,939 $ 2,151,016 $ 629,077 70.8% $ 2,939,269 21.4%4/1/2010 $ 1,649,706 $ 2,319,562 $ 669,856 71.1% $ 2,887,747 23.2%(1) Not applicable prior to June 1, 2004, the aggregate actuarial cost method does not identify or separately amortize unfunded actuarial liabilitiesChanges to prior year reports are based on the latest actuarial reports.60