Total non-operating revenues (expenses) 37,181 (488,485) (155,237) (4,085) 94,035 142,459,699 141,943,108 - 141,943,108Bi-State Development Agency of theMissouri-Illinois <strong>Metro</strong>politan DistrictSupplemental InformationCombining Schedule of Revenues, Expenses and Changes in Net AssetsFor the Year Ended June 30, 2010Gateway Gateway GatewayArch Arch Arch St. Louis TotalsGeneral Tram Parking Riverfront Downtown <strong>Transit</strong> Interfund AfterAgency System Facility Attractions Airport System Totals Eliminations EliminationsOperating revenuesPassenger and service revenues $ - $ 5,421,501 $ 1,755,106 $ 2,438,349 $ 1,190,076 $ 46,229,398 $ 57,034,430 $ (110,073) $ 56,924,357Interfund administrative fees 2,209,741 - - - - - 2,209,741 (2,209,741)Other 447,745 (31,920) 34,896 64,508 190,598 2,911,101 3,616,928 - 3,616,928Total operating revenues 2,657,486 5,389,581 1,790,002 2,502,857 1,380,674 49,140,499 62,861,099 (2,319,814) 60,541,285Operating expensesWages and benefits 1,330,690 1,304,411 385,910 1,194,801 818,469 141,323,808 146,358,089 - 146,358,089Services 599,322 868,298 465,255 415,636 8,298 20,921,946 23,278,755 - 23,278,755Materials and supplies 16,543 167,658 24,521 582,667 120,386 28,038,188 28,949,963 - 28,949,963Casualty and liability costs - 37,991 30,502 142,838 51,318 4,832,084 5,094,733 - 5,094,733Interfund administrative charges - 597,491 143,196 - 69,054 1,400,000 2,209,741 -(2,209,741)Electricity, telephone, leases, & other general exp 162,233 786,726 70,141 283,874 192,305 8,343,927 9,839,206 (110,073) 9,729,133Depreciation and amortization 7,320 392,188 411,411 294,367 1,297,391 74,813,944 77,216,621 - 77,216,621Total operating expenses 2,116,108 4,154,763 1,530,936 2,914,183 2,557,221 279,673,897 292,947,108 (2,319,814) 290,627,294Operating income (loss) 541,378 1,234,818 259,066 (411,326) (1,176,547) (230,533,398) (230,086,009) - (230,086,009)Non-operating revenues (expenses)Grants and assistanceState and local assistance - - - - - 134,521,218 134,521,218 - 134,521,218Federal assistance - - - - 52,900 37,506,178 37,559,078 - - 37,559,078Interest income 7,081 13,974 711 278 415 16,365,826 16,388,285 - 16,388,285Interest expense - - (155,948) - - (43,090,628) (43,246,576) - (43,246,576)Contributions to outside entities (5,000) (292,216) - (100) - (957,197) (1,254,513) - (1,254,513)Gain or (loss) on disposition of assets - (210,243) - (4,263) - (2,070,019) (2,284,525) - (2,284,525)Other non-operating revenue (expense) 35,100 - - - 40,720 184,321 260,141 - 260,141beforecontributions and transfers 578,559 746,333 103,829 (415,411) (1,082,512) (88,073,699) (88,142,901) - (88,142,901)Capital contributions - - - - 5,472,680 21,312,329 26,785,009 - 26,785,009Change in net assets 578,559 746,333 103,829 (415,411) 4,390,168 (66,761,370) (61,357,892) - (61,357,892)Total net assets, July 1, 2009 761,211 12,374,908 1,428,766 2,557,505 16,061,425 720,740,802 753,924,617 - 753,924,617Total net assets, June 30, 2010 $ 1,339,770 $ 13,121,241 $ 1,532,595 $ 2,142,094 $ 20,451,593 $ 653,979,432 $ 692,566,725 $ - $ 692,566,72569
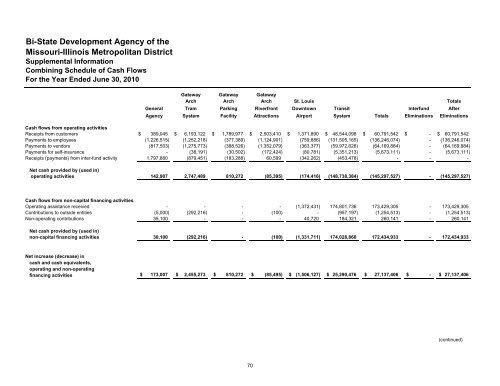
Bi-State Development Agency of theMissouri-Illinois <strong>Metro</strong>politan DistrictSupplemental InformationCombining Schedule of Cash FlowsFor the Year Ended June 30, 2010Gateway Gateway GatewayArch Arch Arch St. Louis TotalsGeneral Tram Parking Riverfront Downtown <strong>Transit</strong> Interfund AfterAgency System Facility Attractions Airport System Totals Eliminations EliminationsCash flows from operating activitiesReceipts from customers $ 389,045 $ 6,193,122 $ 1,789,977 $ 2,503,410 $ 1,371,890 $ 48,544,098 $ 60,791,542 $ - $ 60,791,542Payments to employees (1,226,515) (1,252,218) (377,389) (1,124,901) (759,886) (131,505,165) (136,246,074) - (136,246,074)Payments to vendors (817,503) (1,275,773) (388,526) (1,352,079) (363,377) (59,972,626) (64,169,884) - (64,169,884)Payments for self-insurance - (38,191) (30,502) (172,424) (80,781) (5,351,213) (5,673,111) - (5,673,111)Receipts (payments) from inter-fund activity 1,797,880 (879,451) (183,288) 60,599 (342,262) (453,478) - - -in)operating activities 142,907 2,747,489 810,272 (85,395) (174,416) (148,738,384) (145,297,527) - (145,297,527)Cash flows from non-capital financing activitiesOperating assistance received - - - - (1,372,431) 174,801,736 173,429,305 - 173,429,305Contributions to outside entities (5,000) (292,216) - (100) - (957,197) (1,254,513) - (1,254,513)Non-operating contributions 35,100 - - - 40,720 184,321 260,141 - 260,141Net cash provided by (used in)non-capital financing activities 30,100 (292,216) - (100) (1,331,711) 174,028,860 172,434,933 - 172,434,933Net increase (decrease) incash and cash equivalents,operating and non-operatingfinancing activities $ 173,007 $ 2,455,273 $ 810,272 $ (85,495) $ (1,506,127) $ 25,290,476 $ 27,137,406 $ - $ 27,137,406(continued)70