

Comprehensive Annual Financial Report - Metro Transit
Comprehensive Annual Financial Report - Metro Transit
Comprehensive Annual Financial Report - Metro Transit

Create successful ePaper yourself
Turn your PDF publications into a flip-book with our unique Google optimized e-Paper software.
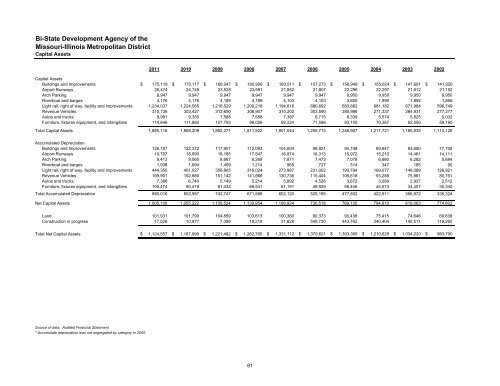
Bi-State Development Agency of theMissouri-Illinois <strong>Metro</strong>politan DistrictCapital Assets2011 2010 2009 2008 2007 2006 2005 2004 2003 2002Capital AssetsBuildings and Improvements $ 175,119 $ 170,117 $ 168,047 $ 160,956 $ 160,511 $ 157,273 $ 156,949 $ 155,024 $ 147,691 $ 141,920Airport Runways 26,474 24,745 23,528 23,691 21,852 21,807 22,296 22,297 21,612 21,152Arch Parking 9,947 9,947 9,947 9,947 9,947 9,947 9,950 9,950 9,950 9,950Riverboat and barges 4,176 4,176 4,189 4,189 4,103 4,103 3,600 1,990 1,892 1,856Light rail, right of way, facility and improvements 1,234,037 1,224,565 1,218,529 1,200,218 1,194,818 680,692 683,682 681,182 671,984 596,749Revenue Vehicles 310,736 303,427 312,650 306,907 310,202 303,590 280,986 271,337 264,931 277,277Autos and trucks 9,981 9,350 7,588 7,588 7,387 6,715 6,339 5,574 5,825 5,032Furniture, fixtures equipment, and intangibles 114,646 111,882 107,793 98,026 92,224 71,586 83,105 70,367 62,050 59,190Total Capital Assets 1,885,116 1,858,209 1,852,271 1,811,522 1,801,044 1,255,713 1,246,907 1,217,721 1,185,935 1,113,126Accumulated DepreciationBuildings and ImprovementsAirport RunwaysArch ParkingRiverboat and bargesLight rail, right of way, facility and improvementsRevenue VehiclesAutos and trucksFurniture, fixtures equipment, and intangiblesTotal Accumulated Depreciation126,78719,7679,4131,938444,350169,9017,386100,474880,016122,37218,9909,0651,694401,027152,6806,74090,419802,987117,90718,1858,6671,459358,805151,1425,14981,433742,747112,09317,5478,2691,214316,024141,6665,21469,541671,568104,60416,8747,871965273,987130,7365,89261,191602,12099,82116,3137,473727231,002115,4044,52649,929525,19594,74815,9727,078514193,794105,6183,67256,406477,80289,64715,2106,680347169,07793,2883,08945,573422,91183,65014,4616,282185149,08975,8612,93734,407366,87277,70514,1115,88490126,92180,7612,51230,340338,324Net Capital Assets 1,005,100 1,055,222 1,109,524 1,139,954 1,198,924 730,518 769,105 794,810 819,063 774,802LandConstruction in progress101,93117,526101,79910,977104,8597,099103,61319,218100,36031,82890,373549,73090,438443,76275,415340,40474,646140,51169,638119,260Total Net Capital Assets $ 1,124,557 $ 1,167,998 $ 1,221,482 $ 1,262,785 $ 1,331,112 $ 1,370,621 $ 1,303,305 $ 1,210,629 $ 1,034,220 $ 963,700Source of data: Audited <strong>Financial</strong> Statement* Accumulate depreciation was not segregated by category in 2000.81


