Bi-State Development Agency of theMissouri-Illinois <strong>Metro</strong>politan DistrictManagement’s Discussion and AnalysisJune 30, 2011 and 20102011 2010 Incr (Decr) % Change 2009 Incr (Decr) % ChangePassenger and service revenues $ 57,403 $ 56,924 $ 479 0.8% $ 59,498 $ (2,574) -4.3%Other 4,438 3,617 821 22.7% 3,179 438 13.8%Total operating revenues 61,841 60,541 1,300 2.1% 62,677 (2,136) -3.4%Wages and benefits 153,788 146,358 7,430 5.1% 149,602 (3,244) -2.2%Services 26,675 23,279 3,396 14.6% 25,094 (1,815) -7.2%Materials and supplies 32,209 28,950 3,259 11.3% 30,058 (1,108) -3.7%Casualty and liability costs 6,193 5,095 1,098 21.6% 3,914 1,181 30.2%Utilities, leases, and other general expenses 10,338 9,729 609 6.3% 12,438 (2,709) -21.8%Depreciation and amortization 78,297 77,216 1,081 1.4% 78,773 (1,557) -2.0%Total operating expenses 307,500 290,627 16,873 5.8% 299,879 (9,252) -3.1%Operating loss (245,659) (230,086) (15,573) 6.8% (237,202) 7,116 3.0%Grants and assistance 197,185 172,080 25,105 14.6% 174,767 (2,687) -1.5%Interest income 598 16,388 (15,790) -96.4% 27,759 (11,371) -41.0%Other 1,162 261 901 345.2% 777 (516) -66.4%Total non-operating revenues 198,945 188,729 10,216 5.4% 203,303 (14,574) -7.2%Interest expense (22,897) (43,247) 20,350 47.1% (53,616) 10,369 19.3%Contribution to outside entities (2,110) (1,255) (855) -68.1% (1,771) 516 29.1%Legal settlement - (1,550) 1,550 100.0% - (1,550) -100.0%Gain (loss) on capital lease termination (6,489) - (6,489) -100.0% - - 0.0%Gain (loss) disposition of assets 2 (734) 736 100.3% 1,320 (2,054) -155.6%Total non-operating expenses (31,494) (46,786) 15,292 32.7% (54,067) 7,281 13.5%Loss before contributions (78,208) (88,143) 9,935 11.3% (87,966) (177) -0.2%Capital contributions 44,272 26,785 17,487 65.3% 28,553 (1,768) -6.2%Change in net assets (33,936) (61,358) 27,422 44.7% (59,413) (1,945) -3.3%Total net assets, beginning of year 692,567 753,925 (61,358) -8.1% 813,338 (59,413) -7.3%Total net assets, end of year $ 658,631 $ 692,567 $ (33,936) -4.9% $ 753,925 $ (61,358) -8.1%FY 2011 Passenger and Service Revenue<strong>Transit</strong>passengerrevenue82.6%Gateway Arch9.4%St. LouisDowntownAirport2.0%GatewayParking3.0%GatewayRiverfront3.0%Other generalexpenses3.3%Casualty andliability costs2.0%FY 2011 Operating ExpenseDepreciation25.5%Services8.7%Materials andsupplies10.5%Wages andbenefits50.0%CAPITAL ASSETS AND DEBT ADMINISTRATION<strong>Metro</strong>’s investment in capital assets for all funds amounted to $1.12 billion, net ofaccumulated depreciation. This investment includes capital asset categories shown in thetable below. The decrease in <strong>Metro</strong>’s capital assets for the current fiscal year was $43.47
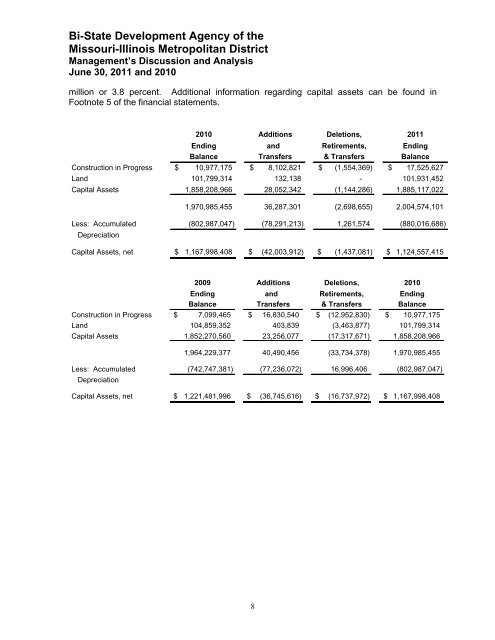
Bi-State Development Agency of theMissouri-Illinois <strong>Metro</strong>politan DistrictManagement’s Discussion and AnalysisJune 30, 2011 and 2010million or 3.8 percent. Additional information regarding capital assets can be found inFootnote 5 of the financial statements.2010 Additions Deletions, 2011Ending and Retirements, EndingBalance Transfers & Transfers BalanceConstruction in Progress $ 10,977,175 $ 8,102,821 $ (1,554,369) $ 17,525,627Land 101,799,314 132,138 - 101,931,452Capital Assets 1,858,208,966 28,052,342 (1,144,286) 1,885,117,0221,970,985,455 36,287,301 (2,698,655) 2,004,574,101Less: Accumulated (802,987,047) (78,291,213) 1,261,574 (880,016,686)DepreciationCapital Assets, net $ 1,167,998,408 $ (42,003,912) $ (1,437,081) $ 1,124,557,4152009 Additions Deletions, 2010Ending and Retirements, EndingBalance Transfers & Transfers BalanceConstruction in Progress $ 7,099,465 $ 16,830,540 $ (12,952,830) $ 10,977,175Land 104,859,352 403,839 (3,463,877) 101,799,314Capital Assets 1,852,270,560 23,256,077 (17,317,671) 1,858,208,9661,964,229,377 40,490,456 (33,734,378) 1,970,985,455Less: Accumulated (742,747,381) (77,236,072) 16,996,406 (802,987,047)DepreciationCapital Assets, net $ 1,221,481,996 $ (36,745,616) $ (16,737,972) $ 1,167,998,4088