

Comprehensive Annual Financial Report - Metro Transit
Comprehensive Annual Financial Report - Metro Transit
Comprehensive Annual Financial Report - Metro Transit

Create successful ePaper yourself
Turn your PDF publications into a flip-book with our unique Google optimized e-Paper software.
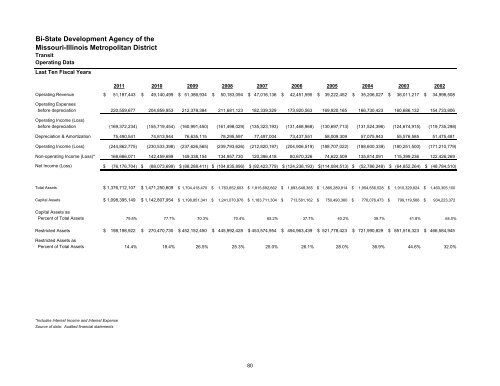
Bi-State Development Agency of theMissouri-Illinois <strong>Metro</strong>politan District<strong>Transit</strong>Operating DataLast Ten Fiscal Years2011 2010 2009 2008 2007 2006 2005 2004 2003 2002Operating Revenue $ 51,187,443 $ 49,140,499 $ 51,386,934 $ 50,183,094 $ 47,016,136 $ 42,451,595 $ 39,222,452 $ 35,206,027 $ 36,011,217 $ 34,998,508Operating Expensesbefore depreciation 220,559,677 204,859,953 212,378,384 211,681,123 182,339,329 173,920,563 169,920,165 166,730,423 160,686,132 154,733,806Operating Income (Loss)before depreciation (169,372,234) (155,719,454) (160,991,450) (161,498,029) (135,323,193) (131,468,968) (130,697,713) (131,524,396) (124,674,915) (119,735,298)Depreciation & Amortization 75,490,541 74,813,944 76,635,115 78,295,597 77,497,004 73,437,551 58,009,309 57,075,943 55,576,585 51,475,481Operating Income (Loss) (244,862,775) (230,533,398) (237,626,565) (239,793,626) (212,820,197) (204,906,519) (188,707,022) (188,600,339) (180,251,500) (171,210,779)Non-operating Income (Loss)* 168,686,071 142,459,699 149,338,154 134,957,730 120,396,418 80,670,326 74,622,509 135,814,091 115,399,236 122,426,269Net Income (Loss) $ (76,176,704) $ (88,073,699) $ (88,288,411) $ (104,835,896) $ (92,423,779) $ (124,236,193) $ (114,084,513) $ (52,786,248) $ (64,852,264) $ (48,784,510)Total Assets $ 1,376,712,107 $ 1,471,250,609 $ 1,704,418,470 $ 1,763,652,603 $ 1,815,692,662 $ 1,893,648,365 $ 1,865,289,914 $ 1,954,556,528 $ 1,910,329,924 $ 1,460,305,100Capital Assets $ 1,098,395,149 $ 1,142,807,954 $ 1,198,851,341 $ 1,241,070,976 $ 1,183,711,304 $ 713,581,162 $ 750,490,360 $ 776,076,473 $ 799,119,566 $ 934,223,372Capital Assets asPercent of Total Assets 79.8% 77.7% 70.3% 70.4% 65.2% 37.7% 40.2% 39.7% 41.8% 64.0%Restricted Assets $ 198,198,922 $ 270,470,730 $ 452,152,450 $ 445,992,428 $ 453,574,954 $ 494,963,439 $ 521,778,423 $ 721,990,829 $ 851,516,323 $ 466,584,945Restricted Assets asPercent of Total Assets 14.4% 18.4% 26.5% 25.3% 25.0% 26.1% 28.0% 36.9% 44.6% 32.0%*Includes Interest Income and Interest ExpenseSource of data: Audited financial statements80


