

Comprehensive Annual Financial Report - Metro Transit
Comprehensive Annual Financial Report - Metro Transit
Comprehensive Annual Financial Report - Metro Transit

You also want an ePaper? Increase the reach of your titles
YUMPU automatically turns print PDFs into web optimized ePapers that Google loves.
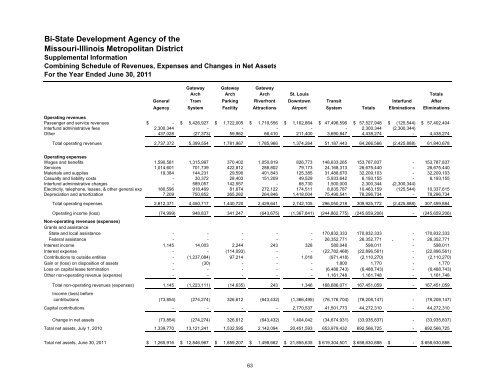
Total non-operating revenues (expenses) 1,145 (1,223,111) (14,635) 243 1,346 168,686,071 167,451,059 - 167,451,059Bi-State Development Agency of theMissouri-Illinois <strong>Metro</strong>politan DistrictSupplemental InformationCombining Schedule of Revenues, Expenses and Changes in Net AssetsFor the Year Ended June 30, 2011Gateway Gateway GatewayArch Arch Arch St. Louis TotalsGeneral Tram Parking Riverfront Downtown <strong>Transit</strong> Interfund AfterAgency System Facility Attractions Airport System Totals Eliminations EliminationsOperating revenuesPassenger and service revenues $ - $ 5,426,927 $ 1,722,005 $ 1,719,556 $ 1,162,864 $ 47,496,596 $ 57,527,948 $ (125,544) $ 57,402,404Interfund administrative fees 2,300,344 - - - - - 2,300,344 (2,300,344)Other 437,028 (27,373) 59,962 66,410 211,400 3,690,847 4,438,274 - 4,438,274Total operating revenues 2,737,372 5,399,554 1,781,967 1,785,966 1,374,264 51,187,443 64,266,566 (2,425,888) 61,840,678Operating expensesWages and benefits 1,590,581 1,315,997 370,402 1,050,819 826,773 148,633,265 153,787,837 - 153,787,837Services 1,014,601 701,739 422,812 288,802 79,173 24,168,313 26,675,440 - 26,675,440Materials and supplies 19,384 144,231 29,590 401,843 125,385 31,488,670 32,209,103 - 32,209,103Casualty and liability costs - 30,372 28,403 151,209 49,529 5,933,642 6,193,155 - 6,193,155Interfund administrative charges - 589,057 142,557 - 68,730 1,500,000 2,300,344 -(2,300,344)Electricity, telephone, leases, & other general exp 180,596 918,469 81,674 272,122 174,511 8,835,787 10,463,159 (125,544) 10,337,615Depreciation and amortization 7,209 750,852 365,282 264,846 1,418,004 75,490,541 78,296,734 - 78,296,734Total operating expenses 2,812,371 4,450,717 1,440,720 2,429,641 2,742,105 296,050,218 309,925,772 (2,425,888) 307,499,884Operating income (loss) (74,999) 948,837 341,247 (643,675) (1,367,841) (244,862,775) (245,659,206) - (245,659,206)Non-operating revenues (expenses)Grants and assistanceState and local assistance - - - - - 170,832,333 170,832,333 - 170,832,333Federal assistance - - - - - 26,352,771 26,352,771 - - 26,352,771Interest income 1,145 14,003 2,244 243 328 580,048 598,011 - 598,011Interest expense - - (114,093) - - (22,782,468) (22,896,561) - (22,896,561)Contributions to outside entities - (1,237,084) 97,214 - 1,018 (971,418) (2,110,270) - (2,110,270)Gain or (loss) on disposition of assets - (30) - - - 1,800 1,770 - 1,770Loss on capital lease termination - - - - - (6,488,743) (6,488,743) - (6,488,743)Other non-operating revenue (expense) - - - - - 1,161,748 1,161,748 - 1,161,748beforecontributions (73,854) (274,274) 326,612 (643,432) (1,366,495) (76,176,704) (78,208,147) - (78,208,147)Capital contributions - - - - 2,770,537 41,501,773 44,272,310 - 44,272,310Change in net assets (73,854) (274,274) 326,612 (643,432) 1,404,042 (34,674,931) (33,935,837) - (33,935,837)Total net assets, July 1, 2010 1,339,770 13,121,241 1,532,595 2,142,094 20,451,593 653,979,432 692,566,725 - 692,566,725Total net assets, June 30, 2011 $ 1,265,916 $ 12,846,967 $ 1,859,207 $ 1,498,662 $ 21,855,635 $ 619,304,501 $ 658,630,888 $ - $ 658,630,88863


