

Comprehensive Annual Financial Report - Metro Transit
Comprehensive Annual Financial Report - Metro Transit
Comprehensive Annual Financial Report - Metro Transit

You also want an ePaper? Increase the reach of your titles
YUMPU automatically turns print PDFs into web optimized ePapers that Google loves.
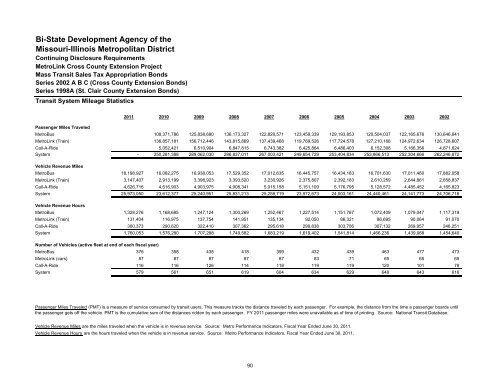
Bi-State Development Agency of theMissouri-Illinois <strong>Metro</strong>politan DistrictContinuing Disclosure Requirements<strong>Metro</strong>Link Cross County Extension ProjectMass <strong>Transit</strong> Sales Tax Appropriation BondsSeries 2002 A B C (Cross County Extension Bonds)Series 1998A (St. Clair County Extension Bonds)<strong>Transit</strong> System Mileage Statistics2011 2010 2009 2008 2007 2006 2005 2004 2003 2002Passenger Miles Traveled<strong>Metro</strong>Bus 108,371,786 125,838,680 136,173,327 122,820,571 123,459,339 129,193,853 120,504,037 122,165,676 130,646,641<strong>Metro</strong>Link (Train) 136,857,181 156,712,446 143,815,869 137,439,468 119,769,526 117,724,578 127,210,168 124,972,634 126,728,607Call-A-Ride 5,052,421 6,510,904 6,847,815 6,743,382 6,425,864 6,486,403 6,152,308 5,166,356 4,871,624System - 250,281,388 289,062,030 286,837,011 267,003,421 249,654,729 253,404,834 253,866,513 252,304,666 262,246,872Vehicle Revenue Miles<strong>Metro</strong>Bus 18,198,927 16,082,275 16,938,053 17,529,352 17,012,635 16,445,757 16,434,183 16,701,630 17,011,460 17,882,058<strong>Metro</strong>Link (Train) 3,147,407 2,913,199 3,398,923 3,393,520 3,230,926 2,375,807 2,392,183 2,610,259 2,644,861 2,658,837Call-A-Ride 4,626,716 4,616,903 4,903,975 4,908,341 5,015,158 5,151,109 5,176,795 5,128,572 4,485,452 4,165,823System 25,973,050 23,612,377 25,240,951 25,831,213 25,258,719 23,972,673 24,003,161 24,440,461 24,141,773 24,706,718Vehicle Revenue Hours<strong>Metro</strong>Bus 1,328,276 1,168,685 1,247,124 1,300,269 1,252,467 1,227,514 1,151,787 1,072,409 1,079,047 1,117,319<strong>Metro</strong>Link (Train) 131,404 116,975 137,754 141,951 135,134 92,050 86,321 86,695 90,064 91,070Call-A-Ride 300,373 290,620 322,410 307,362 295,618 299,838 303,706 307,132 269,957 246,251System 1,760,053 1,576,280 1,707,288 1,749,582 1,683,219 1,619,402 1,541,814 1,466,236 1,439,068 1,454,640Number of Vehicles (active fleet at end of each fiscal year)<strong>Metro</strong>Bus 376 358 438 418 399 432 439 463 477 473<strong>Metro</strong>Link (cars) 87 87 87 87 87 83 71 65 65 65Call-A-Ride 116 116 126 114 118 119 119 120 101 78System 579 561 651 619 604 634 629 648 643 616Passenger Miles Traveled (PMT) is a measure of service consumed by transit users. This measure tracks the distance traveled by each passenger. For example, the distance from the time a passenger boards untilthe passenger gets off the vehicle. PMT is the cumulative sum of the distances ridden by each passenger. FY 2011 passenger miles were unavailable as of time of printing. Source: National <strong>Transit</strong> Database.Vehicle Revenue Miles are the miles traveled when the vehicle is in revenue service. Source: <strong>Metro</strong> Performance Indicators, Fiscal Year Ended June 30, 2011.Vehicle Revenue Hours are the hours traveled when the vehicle is in revenue service. Source: <strong>Metro</strong> Performance Indicators, Fiscal Year Ended June 30, 2011.90


