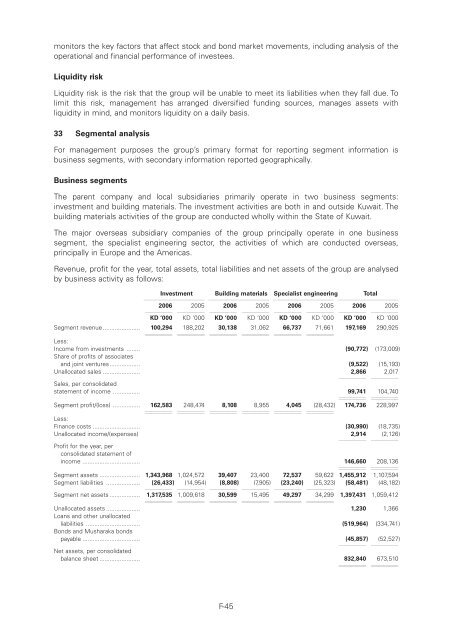
Level: 8 – From: 8 – Thursday, August 9, 2007 – 2:20 pm – mac5 – 3776 Section 10b : 3776 Section 10bmonitors the key factors that affect stock and bond market movements, including analysis of theoperational and financial performance of investees.Liquidity riskLiquidity risk is the risk that the group will be unable to meet its liabilities when they fall due. Tolimit this risk, management has arranged diversified funding sources, manages assets withliquidity in mind, and monitors liquidity on a daily basis.33 Segmental analysisFor management purposes the group’s primary format for reporting segment information isbusiness segments, with secondary information reported geographically.Business segmentsThe parent company and local subsidiaries primarily operate in two business segments:investment and building materials. The investment activities are both in and outside Kuwait. Thebuilding materials activities of the group are conducted wholly within the State of Kuwait.The major overseas subsidiary companies of the group principally operate in one businesssegment, the specialist engineering sector, the activities of which are conducted overseas,principally in Europe and the Americas.Revenue, profit for the year, total assets, total liabilities and net assets of the group are analysedby business activity as follows:Investment Building materials Specialist engineering Total11112111112 11112111112 11112111112 11112111112200611112200511112200611112200511112200611112200511112200611112200511112KD ‘000 KD ‘000 KD ‘000 KD ‘000 KD ‘000 KD ‘000 KD ‘000 KD ‘000Segment revenue ...................... 100,294 11112188,202 1111230,138 1111231,062 1111266,737 1111271,661 11112197,169 290,925Less:Income from investments ........ (90,772) (173,009)Share of profits of associatesand joint ventures.................. (9,522) (15,193)Unallocated sales ...................... 2,866111122,01711112Sales, per consolidatedstatement of income ................ 99,741 11112104,74011112Segment profit/(loss) ................ 162,583 11112248,474 111128,108 111128,955 111124,045 11112(28,432) 11112174,736 228,997Less:Finance costs ............................ (30,990) (18,735)Unallocated income/(expenses) 2,91411112(2,126)11112Profit for the year, perconsolidated statement ofincome .................................. 146,660 11112208,13611112Segment assets ........................ 1,343,968 1,024,572 39,407 23,400 72,537 59,622 1,455,912 1,107,594Segment liabilities .................... (26,433) (14,954)11112 11112(8,808) (7,905)11112 11112(23,240) (25,323)11112 11112(58,481) (48,182)Segment net assets .................. 1,317,535 111121,009,618 1111230,599 1111215,495 1111249,297 1111234,299 111121,397,431 1,059,412Unallocated assets .................... 1,230 1,366Loans and other unallocatedliabilities ................................ (519,964) (334,741)Bonds and Musharaka bondspayable .................................. (45,857) (52,527)11112 11112Net assets, per consolidatedbalance sheet ........................ 832,840 11112673,51011112F-45
Level: 8 – From: 8 – Thursday, August 9, 2007 – 2:20 pm – mac5 – 3776 Section 10b : 3776 Section 10b33 Segmental analysis (continued)Property, plant and equipment of the group are primarily utilised by the building materials segmentand the specialist engineering segment. The additions and depreciation relating to property, plantand equipment by business segment, in which the assets are used, are as follows:Building SpecialistInvestment111112materials engineering Unallocated111112 111112 111112Total111112KD ‘000 KD ‘000 KD ‘000 KD ‘000 KD ‘000At 31 December 2006Additions to property, plant and equipment 39 2,006 6,775 2 8,822Depreciation .............................................. 46 1,773 2,641 180 4,640At 31 December 2005Additions to property, plant and equipment 186 1,920 2,614 - 4,720Depreciation .............................................. 46 1,600 2,684 188 4,518Goodwill capitalised along with the impairment in value relate to the specialist engineeringsegment.Geographical segmentsA segmental analysis of total assets employed and sales by geographical location, are as follows:Assets11112111112Sales11111211112200611112200511112200611112200511112KD ‘000 KD ‘000 KD ‘000 KD ‘000Kuwait .................................................................. 1,014,225 825,494 33,004 33,079Outside Kuwait .................................................... 442,91911112283,4661111266,7371111271,661111121,457,144 111121,108,960 1111299,741 11112104,74011112Additions to property, plant and equipment and goodwill by geographical area in which the assetsare located, are as follows:200611112200511112KD ‘000 KD ‘000Kuwait ........................................................................................................ 5,732 2,106Outside Kuwait............................................................................................ 6,892111122,7231111212,624 111124,82911112F-46
- Page 1 and 2:
Level: 8 - From: 8 - Thursday, Augu
- Page 3 and 4:
Level: 8 - From: 8 - Thursday, Augu
- Page 5:
Level: 8 - From: 8 - Thursday, Augu
- Page 9 and 10:
Level: 8 - From: 8 - Thursday, Augu
- Page 11 and 12:
Level: 8 - From: 8 - Thursday, Augu
- Page 13 and 14:
Level: 8 - From: 8 - Thursday, Augu
- Page 15 and 16:
Level: 8 - From: 8 - Thursday, Augu
- Page 17 and 18:
Level: 8 - From: 8 - Thursday, Augu
- Page 19:
Level: 8 - From: 8 - Thursday, Augu
- Page 22:
Level: 8 - From: 8 - Thursday, Augu
- Page 25 and 26:
Level: 8 - From: 8 - Thursday, Augu
- Page 27 and 28:
Level: 8 - From: 8 - Thursday, Augu
- Page 29 and 30:
Level: 8 - From: 8 - Thursday, Augu
- Page 31 and 32:
Level: 8 - From: 8 - Thursday, Augu
- Page 33 and 34:
Level: 8 - From: 8 - Thursday, Augu
- Page 35 and 36:
Level: 8 - From: 8 - Thursday, Augu
- Page 37 and 38:
Level: 8 - From: 8 - Thursday, Augu
- Page 39 and 40:
Level: 8 - From: 8 - Thursday, Augu
- Page 41 and 42:
Level: 8 - From: 8 - Thursday, Augu
- Page 43 and 44:
Level: 8 - From: 8 - Thursday, Augu
- Page 45 and 46:
Level: 8 - From: 8 - Thursday, Augu
- Page 47 and 48:
Level: 8 - From: 8 - Thursday, Augu
- Page 49 and 50:
Level: 8 - From: 8 - Thursday, Augu
- Page 52 and 53:
Level: 8 - From: 8 - Thursday, Augu
- Page 54 and 55:
Level: 8 - From: 8 - Thursday, Augu
- Page 56 and 57:
Level: 8 - From: 8 - Thursday, Augu
- Page 58 and 59:
Level: 8 - From: 8 - Thursday, Augu
- Page 60 and 61:
Level: 8 - From: 8 - Thursday, Augu
- Page 62 and 63:
Level: 8 - From: 8 - Thursday, Augu
- Page 64 and 65:
Level: 8 - From: 8 - Thursday, Augu
- Page 66 and 67:
Level: 8 - From: 8 - Thursday, Augu
- Page 68 and 69:
Level: 8 - From: 8 - Thursday, Augu
- Page 70 and 71:
Level: 8 - From: 8 - Thursday, Augu
- Page 72 and 73:
Level: 8 - From: 8 - Thursday, Augu
- Page 74 and 75:
Level: 8 - From: 8 - Thursday, Augu
- Page 76 and 77:
Level: 8 - From: 8 - Thursday, Augu
- Page 78 and 79:
Level: 8 - From: 8 - Thursday, Augu
- Page 80 and 81:
Level: 8 - From: 8 - Thursday, Augu
- Page 82 and 83:
Level: 8 - From: 8 - Thursday, Augu
- Page 84 and 85:
Level: 8 - From: 8 - Thursday, Augu
- Page 86 and 87:
Level: 8 - From: 8 - Thursday, Augu
- Page 88 and 89:
Level: 8 - From: 8 - Thursday, Augu
- Page 90 and 91:
Level: 8 - From: 8 - Thursday, Augu
- Page 92 and 93:
Level: 8 - From: 8 - Thursday, Augu
- Page 94 and 95:
Level: 8 - From: 8 - Thursday, Augu
- Page 96 and 97: Level: 8 - From: 8 - Thursday, Augu
- Page 98 and 99: Level: 8 - From: 8 - Thursday, Augu
- Page 100 and 101: Level: 8 - From: 8 - Thursday, Augu
- Page 102 and 103: Level: 8 - From: 8 - Thursday, Augu
- Page 104 and 105: Level: 8 - From: 8 - Thursday, Augu
- Page 106 and 107: Level: 8 - From: 8 - Thursday, Augu
- Page 108 and 109: Level: 8 - From: 8 - Thursday, Augu
- Page 110 and 111: Level: 8 - From: 8 - Thursday, Augu
- Page 112 and 113: Level: 8 - From: 8 - Thursday, Augu
- Page 114 and 115: Level: 8 - From: 8 - Thursday, Augu
- Page 116 and 117: Level: 8 - From: 8 - Thursday, Augu
- Page 118 and 119: Level: 8 - From: 8 - Thursday, Augu
- Page 120 and 121: Level: 8 - From: 8 - Thursday, Augu
- Page 122 and 123: Level: 8 - From: 8 - Thursday, Augu
- Page 124 and 125: Level: 8 - From: 8 - Thursday, Augu
- Page 126 and 127: Level: 8 - From: 8 - Thursday, Augu
- Page 128 and 129: Level: 8 - From: 8 - Thursday, Augu
- Page 130 and 131: Level: 8 - From: 8 - Thursday, Augu
- Page 132 and 133: Level: 8 - From: 8 - Thursday, Augu
- Page 134 and 135: Level: 8 - From: 8 - Thursday, Augu
- Page 136 and 137: Level: 8 - From: 8 - Thursday, Augu
- Page 138 and 139: Level: 8 - From: 8 - Thursday, Augu
- Page 140 and 141: Level: 8 - From: 8 - Thursday, Augu
- Page 142 and 143: Level: 8 - From: 8 - Thursday, Augu
- Page 144 and 145: Level: 8 - From: 8 - Thursday, Augu
- Page 148 and 149: Level: 8 - From: 8 - Thursday, Augu
- Page 150 and 151: Level: 8 - From: 8 - Thursday, Augu
- Page 152 and 153: Level: 8 - From: 8 - Thursday, Augu
- Page 154 and 155: Level: 8 - From: 8 - Thursday, Augu
- Page 156 and 157: Level: 8 - From: 8 - Thursday, Augu
- Page 158 and 159: Level: 8 - From: 8 - Thursday, Augu
- Page 160 and 161: Level: 8 - From: 8 - Thursday, Augu
- Page 162 and 163: Level: 8 - From: 8 - Thursday, Augu
- Page 164 and 165: Level: 8 - From: 8 - Thursday, Augu
- Page 166 and 167: Level: 8 - From: 8 - Thursday, Augu
- Page 168 and 169: Level: 8 - From: 8 - Thursday, Augu
- Page 170 and 171: Level: 8 - From: 8 - Thursday, Augu
- Page 172 and 173: Level: 8 - From: 8 - Thursday, Augu
- Page 174 and 175: Level: 8 - From: 8 - Thursday, Augu
- Page 176 and 177: Level: 8 - From: 8 - Thursday, Augu
- Page 178 and 179: Level: 8 - From: 8 - Thursday, Augu
- Page 180 and 181: Level: 8 - From: 8 - Thursday, Augu
- Page 182 and 183: Level: 8 - From: 8 - Thursday, Augu
- Page 184 and 185: Level: 8 - From: 8 - Thursday, Augu