<strong>Shire</strong> <strong>of</strong> <strong>Roebourne</strong> <strong>Local</strong> <strong>Planning</strong> <strong>Strategy</strong>Technical Report A1: Economic Development <strong>Strategy</strong>majors. Much research and technical development is directed towards improving on-site labourproductivity and increasing the ability to undertake parts <strong>of</strong> operations remotely. This technology is underdevelopment and is being steadily implemented by the major resource companies. This will serve todampen regional population growth generally. Some <strong>of</strong> this is already in place: a current example is theremote control (from Perth) <strong>of</strong> haul trains.Extensions <strong>of</strong> technological applications over time will serve to subdue or even reduce regional labourdemand from resources projects, even as the volume and value-added measures increase. This willserve to dampen regional population growth generally.Australia is currently positioned at the point <strong>of</strong> a major transformation in the world’s economic weight fromwest to east. The rapid industrialisation <strong>of</strong> structurally large Asian economies, predominantly China, hasdriven world economic growth over recent times and changed the dynamics <strong>of</strong> key international resource,product and capital markets.For Australia, this has translated to strong demand and elevated prices for energy and mineral resources,and is underpinning massive investments by the minerals and oil and gas industry in new capacity. Theeconomic advancement in Australia’s region is overwhelmingly positive for Australia, playing tocomparative advantages as a secure and reliable energy exporter.The oil and gas industry currently represents around 2.0% <strong>of</strong> gross domestic product, with direct andflow-on value added <strong>of</strong> approximately $28.3 billion in 2010-11 (based on total sales <strong>of</strong> $29.7 billion).Moreover, the industry’s systemic significance is continuing to grow on the back <strong>of</strong> large LNG exportinvestments, mainly in Western Australia, Queensland and the Northern Territory. Separately, these represent some <strong>of</strong> the biggest projects ever undertaken in Australia; andcollectively, they account for around 35.4% <strong>of</strong> all business investment. Further, if all oil andgas investments are realised, they will comprise over 64% <strong>of</strong> all committed investment. LNG output is expected to grow by around 250% over the next seven years, with a projectedvalue <strong>of</strong> over $35 billion in 2017-18.Importantly, the industry’s economic linkages are broad and deep. Of total industry value added, about$4.3 billion is generated by supplying industries across the economy — including the resource supportservices, maintenance and construction and pr<strong>of</strong>essional services sectors. These linkages areparticularly visible in the thriving resource service hubs which have emerged in Brisbane and Perth, butalso in the supply sectors <strong>of</strong> resource communities such as in the <strong>Shire</strong> <strong>of</strong> <strong>Roebourne</strong>.Building on these linkages, robust export performance by Australia’s oil and gas industry, and otherresource producers more broadly, has provided important income and employment support over thecourse <strong>of</strong> the global downturn. This has played a key role in Australia withstanding the more dramaticeconomic declines which confronted other developed economies.11
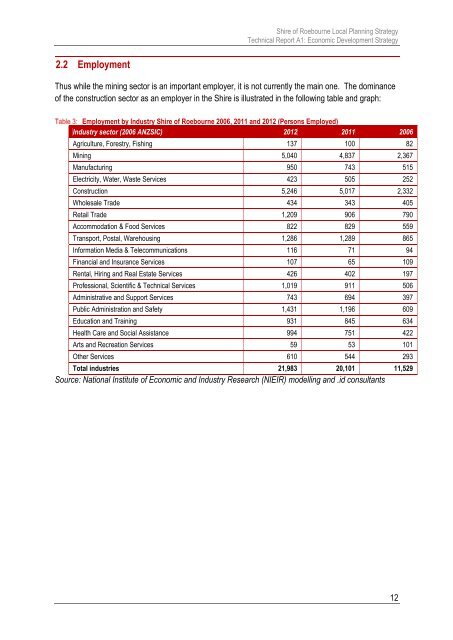
<strong>Shire</strong> <strong>of</strong> <strong>Roebourne</strong> <strong>Local</strong> <strong>Planning</strong> <strong>Strategy</strong>Technical Report A1: Economic Development <strong>Strategy</strong>2.2 EmploymentThus while the mining sector is an important employer, it is not currently the main one. The dominance<strong>of</strong> the construction sector as an employer in the <strong>Shire</strong> is illustrated in the following table and graph:Employment by Industry <strong>Shire</strong> <strong>of</strong> <strong>Roebourne</strong> 2006, 2011 and 2012 (Persons Employed)Industry sector (2006 ANZSIC) 2012 2011 2006Agriculture, Forestry, Fishing 137 100 82Mining 5,040 4,837 2,367Manufacturing 950 743 515Electricity, Water, Waste Services 423 505 252Construction 5,246 5,017 2,332Wholesale Trade 434 343 405Retail Trade 1,209 906 790Accommodation & Food Services 822 829 559Transport, Postal, Warehousing 1,286 1,289 865Information Media & Telecommunications 116 71 94Financial and Insurance Services 107 65 109Rental, Hiring and Real Estate Services 426 402 197Pr<strong>of</strong>essional, Scientific & Technical Services 1,019 911 506Administrative and Support Services 743 694 397Public Administration and Safety 1,431 1,196 609Education and Training 931 845 634Health Care and Social Assistance 994 751 422Arts and Recreation Services 59 53 101Other Services 610 544 293Total industries 21,983 20,101 11,529Source: National Institute <strong>of</strong> Economic and Industry Research (NIEIR) modelling and .id consultants12