Shire of Roebourne Local Planning Strategy
Shire of Roebourne Local Planning Strategy
Shire of Roebourne Local Planning Strategy

Create successful ePaper yourself
Turn your PDF publications into a flip-book with our unique Google optimized e-Paper software.
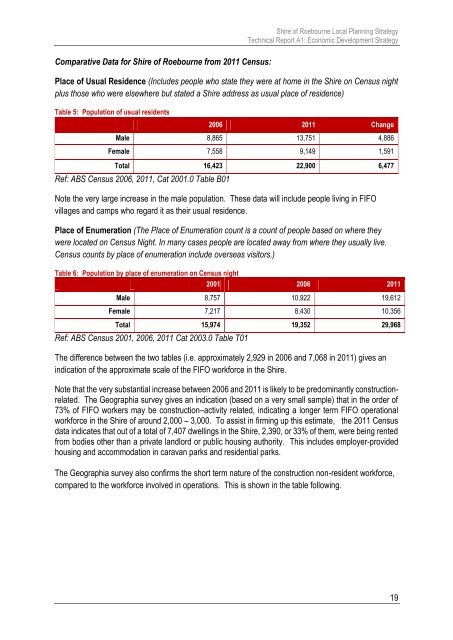
Comparative Data for <strong>Shire</strong> <strong>of</strong> <strong>Roebourne</strong> from 2011 Census:<strong>Shire</strong> <strong>of</strong> <strong>Roebourne</strong> <strong>Local</strong> <strong>Planning</strong> <strong>Strategy</strong>Technical Report A1: Economic Development <strong>Strategy</strong>Place <strong>of</strong> Usual Residence (Includes people who state they were at home in the <strong>Shire</strong> on Census nightplus those who were elsewhere but stated a <strong>Shire</strong> address as usual place <strong>of</strong> residence)Table 5: Population <strong>of</strong> usual residentsRef: ABS Census 2006, 2011, Cat 2001.0 Table B01Note the very large increase in the male population. These data will include people living in FIFOvillages and camps who regard it as their usual residence.Place <strong>of</strong> Enumeration (The Place <strong>of</strong> Enumeration count is a count <strong>of</strong> people based on where theywere located on Census Night. In many cases people are located away from where they usually live.Census counts by place <strong>of</strong> enumeration include overseas visitors.)Table 6: Population by place <strong>of</strong> enumeration on Census night2001 2006 2011Male 8,757 10,922 19,612Female 7,217 8,430 10,356Total 15,974 19,352 29,968Ref: ABS Census 2001, 2006, 2011 Cat 2003.0 Table T012006 2011 ChangeMale 8,865 13,751 4,886Female 7,558 9,149 1,591Total 16,423 22,900 6,477The difference between the two tables (i.e. approximately 2,929 in 2006 and 7,068 in 2011) gives anindication <strong>of</strong> the approximate scale <strong>of</strong> the FIFO workforce in the <strong>Shire</strong>.Note that the very substantial increase between 2006 and 2011 is likely to be predominantly constructionrelated.The Geographia survey gives an indication (based on a very small sample) that in the order <strong>of</strong>73% <strong>of</strong> FIFO workers may be construction–activity related, indicating a longer term FIFO operationalworkforce in the <strong>Shire</strong> <strong>of</strong> around 2,000 – 3,000. To assist in firming up this estimate, the 2011 Censusdata indicates that out <strong>of</strong> a total <strong>of</strong> 7,407 dwellings in the <strong>Shire</strong>, 2,390, or 33% <strong>of</strong> them, were being rentedfrom bodies other than a private landlord or public housing authority. This includes employer-providedhousing and accommodation in caravan parks and residential parks.The Geographia survey also confirms the short term nature <strong>of</strong> the construction non-resident workforce,compared to the workforce involved in operations. This is shown in the table following.19