Shire of Roebourne Local Planning Strategy
Shire of Roebourne Local Planning Strategy
Shire of Roebourne Local Planning Strategy

You also want an ePaper? Increase the reach of your titles
YUMPU automatically turns print PDFs into web optimized ePapers that Google loves.
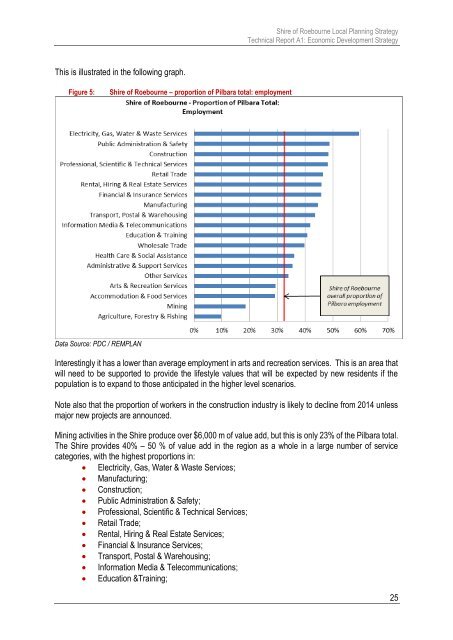
<strong>Shire</strong> <strong>of</strong> <strong>Roebourne</strong> <strong>Local</strong> <strong>Planning</strong> <strong>Strategy</strong>Technical Report A1: Economic Development <strong>Strategy</strong>This is illustrated in the following graph.Figure 5:<strong>Shire</strong> <strong>of</strong> <strong>Roebourne</strong> – proportion <strong>of</strong> Pilbara total: employmentData Source: PDC / REMPLANInterestingly it has a lower than average employment in arts and recreation services. This is an area thatwill need to be supported to provide the lifestyle values that will be expected by new residents if thepopulation is to expand to those anticipated in the higher level scenarios.Note also that the proportion <strong>of</strong> workers in the construction industry is likely to decline from 2014 unlessmajor new projects are announced.Mining activities in the <strong>Shire</strong> produce over $6,000 m <strong>of</strong> value add, but this is only 23% <strong>of</strong> the Pilbara total.The <strong>Shire</strong> provides 40% – 50 % <strong>of</strong> value add in the region as a whole in a large number <strong>of</strong> servicecategories, with the highest proportions in: Electricity, Gas, Water & Waste Services; Manufacturing; Construction; Public Administration & Safety; Pr<strong>of</strong>essional, Scientific & Technical Services; Retail Trade; Rental, Hiring & Real Estate Services; Financial & Insurance Services; Transport, Postal & Warehousing; Information Media & Telecommunications; Education &Training;25