Shire of Roebourne Local Planning Strategy
Shire of Roebourne Local Planning Strategy
Shire of Roebourne Local Planning Strategy

You also want an ePaper? Increase the reach of your titles
YUMPU automatically turns print PDFs into web optimized ePapers that Google loves.
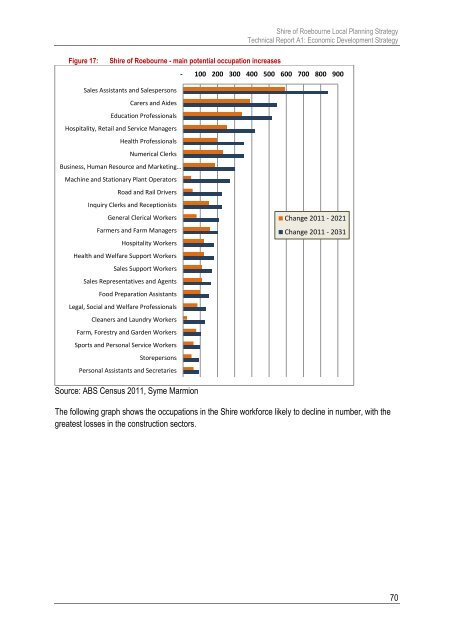
<strong>Shire</strong> <strong>of</strong> <strong>Roebourne</strong> <strong>Local</strong> <strong>Planning</strong> <strong>Strategy</strong>Technical Report A1: Economic Development <strong>Strategy</strong>Figure 17:<strong>Shire</strong> <strong>of</strong> <strong>Roebourne</strong> - main potential occupation increases- 100 200 300 400 500 600 700 800 900Sales Assistants and SalespersonsCarers and AidesEducation Pr<strong>of</strong>essionalsHospitality, Retail and Service ManagersHealth Pr<strong>of</strong>essionalsNumerical ClerksBusiness, Human Resource and Marketing…Machine and Stationary Plant OperatorsRoad and Rail DriversInquiry Clerks and ReceptionistsGeneral Clerical WorkersFarmers and Farm ManagersHospitality WorkersHealth and Welfare Support WorkersSales Support WorkersSales Representatives and AgentsFood Preparation AssistantsLegal, Social and Welfare Pr<strong>of</strong>essionalsCleaners and Laundry WorkersFarm, Forestry and Garden WorkersSports and Personal Service WorkersStorepersonsPersonal Assistants and SecretariesChange 2011 - 2021Change 2011 - 2031Source: ABS Census 2011, Syme MarmionThe following graph shows the occupations in the <strong>Shire</strong> workforce likely to decline in number, with thegreatest losses in the construction sectors.70