Annual Financial Statements 2011 of Bank Austria
Annual Financial Statements 2011 of Bank Austria
Annual Financial Statements 2011 of Bank Austria

Create successful ePaper yourself
Turn your PDF publications into a flip-book with our unique Google optimized e-Paper software.
Management Report<br />
Management Report (CONTINUED)<br />
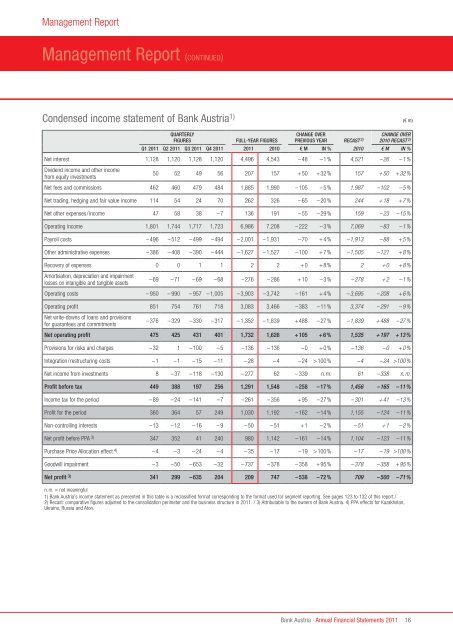
Condensed income statement <strong>of</strong> <strong>Bank</strong> <strong>Austria</strong> 1) (€ m)<br />
QUArTErLY<br />
FIgUrES FULL-YEAr FIgUrES<br />
CHAngE ovEr<br />
PrEvIoUS YEAr recast 2)<br />
cHaNGe OVer<br />
2010 recast 2)<br />
Q1 <strong>2011</strong> Q2 <strong>2011</strong> Q3 <strong>2011</strong> Q4 <strong>2011</strong> <strong>2011</strong> 2010 € m In % 2010 € m IN %<br />
Net interest 1,128 1,120 1,128 1,120 4,496 4,543 –48 –1% 4,521 –26 –1%<br />
Dividend income and other income<br />
from equity investments<br />
50 52 49 56 207 157 +50 +32% 157 +50 +32%<br />
Net fees and commissions 462 460 479 484 1,885 1,990 –105 –5% 1,987 –102 –5%<br />
Net trading, hedging and fair value income 114 54 24 70 262 326 –65 –20% 244 +18 +7%<br />
Net other expenses/income 47 58 38 –7 136 191 –55 –29% 159 –23 –15%<br />
Operating income 1,801 1,744 1,717 1,723 6,986 7,208 –222 –3% 7,069 –83 –1%<br />
Payroll costs –496 –512 –499 –494 –2,001 –1,931 –70 +4% –1,913 –88 +5%<br />
Other administrative expenses –386 –408 –390 –444 –1,627 –1,527 –100 +7% –1,505 –121 +8%<br />
Recovery <strong>of</strong> expenses 0 0 1 1 2 2 +0 +8% 2 +0 +8%<br />
Amortisation, depreciation and impairment<br />
losses on intangible and tangible assets<br />
–69 –71 –69 –68 –276 –286 +10 –3% –278 +2 –1%<br />
Operating costs – 950 – 990 – 957 –1,005 –3,903 –3,742 –161 +4% –3,695 –208 +6%<br />
Operating pr<strong>of</strong>it 851 754 761 718 3,083 3,466 –383 –11% 3,374 –291 –9%<br />
Net write-downs <strong>of</strong> loans and provisions<br />
for guarantees and commitments<br />
–376 –329 –330 –317 –1,352 –1,839 +488 –27% –1,839 +488 –27%<br />
net operating pr<strong>of</strong>it 475 425 431 401 1,732 1,626 +105 +6% 1,535 +197 +13%<br />
Provisions for risks and charges –32 1 –100 –5 –136 –136 –0 +0% –136 –0 +0%<br />
Integration/restructuring costs –1 –1 –15 –11 –28 –4 –24 >100% –4 –24 >100%<br />
Net income from investments 8 –37 –118 –130 –277 62 –339 n.m. 61 –338 n.m.<br />
Pr<strong>of</strong>it before tax 449 388 197 256 1,291 1,548 –258 –17% 1,456 –165 –11%<br />
Income tax for the period –89 –24 –141 –7 –261 –356 +95 –27% –301 +41 –13%<br />
Pr<strong>of</strong>it for the period 360 364 57 249 1,030 1,192 –162 –14% 1,155 –124 –11%<br />
Non-controlling interests –13 –12 –16 –9 –50 –51 +1 –2% –51 +1 –2%<br />
Net pr<strong>of</strong>it before PPA 3) 347 352 41 240 980 1,142 –161 –14% 1,104 –123 –11%<br />
Purchase Price Allocation effect 4) –4 –3 –24 –4 –35 –17 –19 >100% –17 –19 >100%<br />
Goodwill impairment –3 –50 –653 –32 –737 –378 –358 +95% –378 –358 +95%<br />
net pr<strong>of</strong>it 3) 341 299 –635 204 209 747 –538 –72% 709 –500 –71%<br />
n.m. = not meaningful<br />
1) <strong>Bank</strong> <strong>Austria</strong>’s income statement as presented in this table is a reclassified format corresponding to the format used for segment reporting. See pages 123 to 132 <strong>of</strong> this report./<br />
2) Recast: comparative figures adjusted to the consolidation perimeter and the business structure in <strong>2011</strong>. / 3) Attributable to the owners <strong>of</strong> <strong>Bank</strong> <strong>Austria</strong>. 4) PPA effects for Kazakhstan,<br />
Ukraine, Russia and Aton.<br />
<strong>Bank</strong> <strong>Austria</strong> · <strong>Annual</strong> <strong>Financial</strong> <strong>Statements</strong> <strong>2011</strong><br />
16