Annual Financial Statements 2011 of Bank Austria
Annual Financial Statements 2011 of Bank Austria
Annual Financial Statements 2011 of Bank Austria

You also want an ePaper? Increase the reach of your titles
YUMPU automatically turns print PDFs into web optimized ePapers that Google loves.
Management Report<br />
Management Report (CONTINUED)<br />
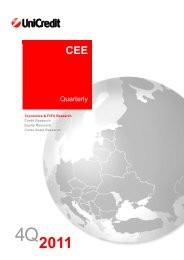
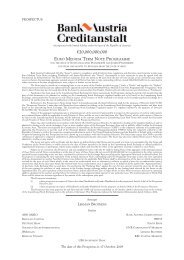
Multi-year trend in total assets, by quarter (€ bn)<br />
240<br />
220<br />
200<br />
180<br />
230<br />
221<br />
209 229<br />
Total assets<br />
203<br />
222<br />
196<br />
191<br />
160<br />
154<br />
140<br />
120<br />
100<br />
80<br />
60<br />
40<br />
20<br />
Leverage ratio<br />
(without intangible assets)<br />
0<br />
D M J S D M J S D M J S D M J S D M J S D<br />
2007 2008 2009 2010 <strong>2011</strong><br />
214 208<br />
194<br />
204<br />
21.9<br />
13.3<br />
201<br />
200 191<br />
198<br />
190<br />
193 194<br />
199<br />
Loans to customers<br />
Primary funds<br />
22<br />
20<br />
18<br />
16<br />
14<br />
12<br />
10<br />
The largest growth in percentage terms was recorded in countries where<br />
our banking subsidiaries enjoy particularly strong confidence among customers<br />
because they are international banks, especially in Russia and<br />
Turkey, as well as in Ukraine and Kazakhstan. debt securities in issue<br />
rose by € 2.4 bn or 8.6% to € 29.9 bn, mainly through successful<br />
mortgage bond issues, with high placement rates in <strong>Austria</strong> making an<br />
important contribution in this regard. As a result <strong>of</strong> these developments,<br />
primary funds (the sum total <strong>of</strong> deposits from customers and debt<br />
securities in issue) rose to € 134.7 bn compared with the end <strong>of</strong> 2010<br />
(+€ 6.8 bn or +5.3%). This means that customer loans were fully<br />
funded by customer deposits in a wider sense as <strong>of</strong> year-end <strong>2011</strong>.<br />
Among the remaining items on the liabilities side, deposits from banks<br />
were slightly below the previous year’s level (–1.1% to € 32.8 bn). The<br />
combined sum total <strong>of</strong> financial liabilities held for trading, financial liabilities<br />
at fair value through pr<strong>of</strong>it or loss and hedging derivatives was also<br />
lower at the end <strong>of</strong> <strong>2011</strong> compared with year-end 2010.<br />
As <strong>of</strong> 31 December <strong>2011</strong>, equity was € 17.7 bn, € 185 m or 1.1%<br />
above the level at the end <strong>of</strong> 2010. It accounted for 8.9% <strong>of</strong> total liabilities<br />
and equity. This development is explained by two factors: first, the<br />
net pr<strong>of</strong>it included in retained earnings was very low in <strong>2011</strong> (€ 258 m<br />
after € 798 m) as a result <strong>of</strong> exceptional non-operating expenses and<br />
the goodwill impairment charge. Second, the effects from foreign currency<br />
translation related to capital consolidation were very negative in<br />
<strong>2011</strong> compared with the previous year (– € 571 m). This negative<br />
impact was not quite <strong>of</strong>fset by an increase in reserves in accordance<br />
with IAS 39 (amounting to a combined figure <strong>of</strong> +€ 533 m) and the<br />
other items directly recognised in equity; the balance <strong>of</strong> income and<br />
expenses recognised directly in equity was slightly negative (– € 23 m).<br />
Together with the net pr<strong>of</strong>it and including the changes in the group <strong>of</strong><br />
consolidated companies (– € 28 m) and distributions (– € 23 m) – both<br />
only concern non-controlling interests – the change in equity amounts<br />
to € 185 m.<br />
Capital resources pursuant<br />
to the <strong>Austria</strong>n <strong>Bank</strong>ing Act<br />
� Risk-weighted assets (RWAs) as at the end <strong>of</strong> <strong>2011</strong> were € 125.2 bn,<br />
down by € 2.7 bn (–2.1%) from the year-end 2010 level. In <strong>Austria</strong>,<br />
the change resulted primarily from the adoption <strong>of</strong> the internal ratingsbased<br />
(IRB) approach for additional exposures and from the adjustment<br />
<strong>of</strong> risk parameters. While several banking subsidiaries switched to the<br />
IRB approach, this had a very small net effect in terms <strong>of</strong> RWAs: a<br />
€ 12.4 bn increase in the IRB portfolio was more or less <strong>of</strong>fset by a<br />
€ 12.2 bn decrease in the portfolio under the standardised approach.<br />
On the other hand, business expansion in CEE led to an increase,<br />
which was partly <strong>of</strong>fset by exchange rate movements.<br />
The implementation <strong>of</strong> CRD III, which involved a higher capital requirement<br />
for stressed value-at-risk and incremental risk charge, led to<br />
a € 1.3 bn increase in RWAs from the trading book at the end <strong>of</strong><br />
December <strong>2011</strong> compared with the previous year.<br />
As a result <strong>of</strong> lower RWAs, the capital requirement for credit risk<br />
declined to € 8.8 bn (–3.7%) and the capital requirement for all types<br />
<strong>of</strong> risk was € 10.0 bn (–2.1%).<br />
� In <strong>2011</strong>, net capital resources rose by € 0.4 bn (+2.3%) to<br />
€ 15.9 bn. Negative consolidation effects were reduced by write-downs<br />
on equity interests and capital measures. The shortfall-related deduction<br />
declined by € 0.2 bn as write-downs rose. Tier 2 capital declined<br />
by € 0.2 bn as a lower amount <strong>of</strong> subordinated capital was eligible for<br />
inclusion in view <strong>of</strong> its residual maturity.<br />
� The increase in Tier 1 capital in combination with the RWA reduction<br />
compared with the end <strong>of</strong> 2010 resulted in higher Tier 1 capital ratios and<br />
total capital ratios. The Core Tier 1 capital ratio (Tier 1 capital ratio without<br />
hybrid capital) based on all risks rose from 10.04% to 10.55%. The Core<br />
Tier 1 capital ratio based on credit risk rose from 11.33% to 12.10%.<br />
Capital ratios<br />
31 dEC. <strong>2011</strong> 31 dEC. 2010<br />
based on all risks 1)<br />
Tier 1 capital ratio 10.88% 10.35%<br />
… without hybrid capital (Core Tier 1 capital ratio) 10.55% 10.04%<br />
Total capital ratio 12.68% 12.13%<br />
based on credit risk 2)<br />
Tier 1 capital ratio 12.47% 11.68%<br />
… without hybrid capital (Core Tier 1 capital ratio) 12.10% 11.33%<br />
Total capital ratio 13.37% 12.67%<br />
1) Credit risk, operational risk, position risk and settlement risk. / 2) Capital resources<br />
less requirement for the trading book and for commodities risk, exchange rate risk and<br />
operational risk as a percentage <strong>of</strong> the risk-weighted assessment basis for credit risk.<br />
<strong>Bank</strong> <strong>Austria</strong> · <strong>Annual</strong> <strong>Financial</strong> <strong>Statements</strong> <strong>2011</strong><br />
22