Annual Financial Statements 2011 of Bank Austria
Annual Financial Statements 2011 of Bank Austria
Annual Financial Statements 2011 of Bank Austria

Create successful ePaper yourself
Turn your PDF publications into a flip-book with our unique Google optimized e-Paper software.
Management Report<br />
Management Report (CONTINUED)<br />
<strong>Financial</strong> and non-financial performance indicators<br />
Volume, pr<strong>of</strong>itability and resources<br />
Average loans and receivables with customers rose by 2.8% to<br />
€ 131 bn in <strong>2011</strong>, after a decline in the crisis year 2009 and stagnation<br />
<strong>of</strong> average volume in 2010. While the CEE business segment<br />
accounted for all the increase, lending volume in <strong>Austria</strong>n customer<br />
business was more or less maintained (see table). In both regions,<br />
currency movements were a significant factor: at constant exchange<br />
rates, lending volume in CEE was 4 percentage points higher, and<br />
fluctuations in <strong>Austria</strong> during the year were explained by appreciation<br />
and depreciation <strong>of</strong> the Swiss franc. The annual averages show an<br />
underlying upward trend from quarter to quarter, which started at the<br />
end <strong>of</strong> 2009; this development also resulted from the growth markets<br />
in Central and Eastern Europe. Average lending volume in CEE<br />
was again higher than in the three <strong>Austria</strong>n customer business segments<br />
in <strong>2011</strong>. But the difference – € 67 bn in CEE compared with<br />
€ 64 bn in <strong>Austria</strong> – is not very large given the structure <strong>of</strong> the loan<br />
portfolio in <strong>Austria</strong> and the market position in corporate banking.<br />
The ratio <strong>of</strong> average loans to customer deposits is also higher in<br />
<strong>Austria</strong> than in CEE.<br />
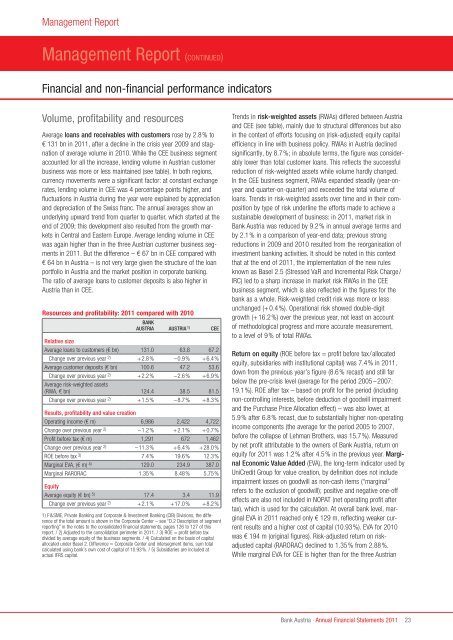
Resources and pr<strong>of</strong>itability: <strong>2011</strong> compared with 2010<br />
BAnK<br />
AUSTrIA AUSTrIA 1) CEE<br />
relative size<br />
Average loans to customers (€ bn) 131.0 63.8 67.2<br />
Change over previous year 2) +2.8% –0.9% +6.4%<br />
Average customer deposits (€ bn) 100.6 47.2 53.6<br />
Change over previous year 2) +2.2% –2.6% +6.9%<br />
Average risk-weighted assets<br />
(RWA, € bn) 124.4 38.5 81.5<br />
Change over previous year 2) +1.5% –8.7% +8.3%<br />
results, pr<strong>of</strong>itability and value creation<br />
Operating income (€ m) 6,986 2,422 4,722<br />
Change over previous year 2) –1.2% +2.1% +0.7%<br />
Pr<strong>of</strong>it before tax (€ m) 1,291 672 1,462<br />
Change over previous year 2) –11.3% +6.4% +28.0%<br />
ROE before tax 3) 7.4% 19.6% 12.3%<br />
Marginal EVA, (€ m) 4) 129.0 234.9 387.0<br />
Marginal RARORAC 1.35% 8.48% 5.75%<br />
Equity<br />
Average equity (€ bn) 5) 17.4 3.4 11.9<br />
Change over previous year 2) +2.1% +17.0% +8.2%<br />
1) F&SME, Private <strong>Bank</strong>ing and Corporate & Investment <strong>Bank</strong>ing (CIB) Divisions, the difference<br />
<strong>of</strong> the total amount is shown in the Corporate Center – see “D.2 Description <strong>of</strong> segment<br />
reporting” in the notes to the consolidated financial statements, pages 126 to 127 <strong>of</strong> this<br />
report. / 2) Adjusted to the consolidation perimeter in <strong>2011</strong>. / 3) ROE = pr<strong>of</strong>it before tax<br />
divided by average equity <strong>of</strong> the business segments. / 4) Calculated on the basis <strong>of</strong> capital<br />
allocated under Basel 2. Difference = Corporate Center and intersegment items, sum total<br />
calculated using bank’s own cost <strong>of</strong> capital <strong>of</strong> 10.93%. / 5) Subsidiaries are included at<br />
actual IFRS capital.<br />
Trends in risk-weighted assets (RWAs) differed between <strong>Austria</strong><br />
and CEE (see table), mainly due to structural differences but also<br />
in the context <strong>of</strong> efforts focusing on (risk-adjusted) equity capital<br />
efficiency in line with business policy. RWAs in <strong>Austria</strong> declined<br />
significantly, by 8.7%; in absolute terms, the figure was considerably<br />
lower than total customer loans. This reflects the successful<br />
reduction <strong>of</strong> risk-weighted assets while volume hardly changed.<br />
In the CEE business segment, RWAs expanded steadily (year-onyear<br />
and quarter-on-quarter) and exceeded the total volume <strong>of</strong><br />
loans. Trends in risk-weighted assets over time and in their composition<br />
by type <strong>of</strong> risk underline the efforts made to achieve a<br />
sustainable development <strong>of</strong> business: in <strong>2011</strong>, market risk in<br />
<strong>Bank</strong> <strong>Austria</strong> was reduced by 9.2% in annual average terms and<br />
by 2.1% in a comparison <strong>of</strong> year-end data; previous strong<br />
reductions in 2009 and 2010 resulted from the reorganisation <strong>of</strong><br />
investment banking activities. It should be noted in this context<br />
that at the end <strong>of</strong> <strong>2011</strong>, the implementation <strong>of</strong> the new rules<br />
known as Basel 2.5 (Stressed VaR and Incremental Risk Charge/<br />
IRC) led to a sharp increase in market risk RWAs in the CEE<br />
business segment, which is also reflected in the figures for the<br />
bank as a whole. Risk-weighted credit risk was more or less<br />
unchanged (+0.4%). Operational risk showed double-digit<br />
growth (+16.2%) over the previous year, not least on account<br />
<strong>of</strong> methodological progress and more accurate measurement,<br />
to a level <strong>of</strong> 9% <strong>of</strong> total RWAs.<br />
return on equity (ROE before tax = pr<strong>of</strong>it before tax/allocated<br />
equity, subsidiaries with institutional capital) was 7.4% in <strong>2011</strong>,<br />
down from the previous year’s figure (8.6% recast) and still far<br />
below the pre-crisis level (average for the period 2005–2007:<br />
19.1%). ROE after tax – based on pr<strong>of</strong>it for the period (including<br />
non-controlling interests, before deduction <strong>of</strong> goodwill impairment<br />
and the Purchase Price Allocation effect) – was also lower, at<br />
5.9% after 6.8% recast, due to substantially higher non-operating<br />
income components (the average for the period 2005 to 2007,<br />
before the collapse <strong>of</strong> Lehman Brothers, was 15.7%). Measured<br />
by net pr<strong>of</strong>it attributable to the owners <strong>of</strong> <strong>Bank</strong> <strong>Austria</strong>, return on<br />
equity for <strong>2011</strong> was 1.2% after 4.5% in the previous year. marginal<br />
Economic value Added (EVA), the long-term indicator used by<br />
UniCredit Group for value creation, by definition does not include<br />
impairment losses on goodwill as non-cash items (“marginal”<br />
refers to the exclusion <strong>of</strong> goodwill); positive and negative one-<strong>of</strong>f<br />
effects are also not included in NOPAT (net operating pr<strong>of</strong>it after<br />
tax), which is used for the calculation. At overall bank level, marginal<br />
EVA in <strong>2011</strong> reached only € 129 m, reflecting weaker current<br />
results and a higher cost <strong>of</strong> capital (10.93%). EVA for 2010<br />
was € 194 m (original figures). Risk-adjusted return on riskadjusted<br />
capital (RARORAC) declined to 1.35% from 2.88%.<br />
While marginal EVA for CEE is higher than for the three <strong>Austria</strong>n<br />
<strong>Bank</strong> <strong>Austria</strong> · <strong>Annual</strong> <strong>Financial</strong> <strong>Statements</strong> <strong>2011</strong><br />
23