Benchlearning methodology and data gathering template
Benchlearning methodology and data gathering template
Benchlearning methodology and data gathering template
- No tags were found...
You also want an ePaper? Increase the reach of your titles
YUMPU automatically turns print PDFs into web optimized ePapers that Google loves.
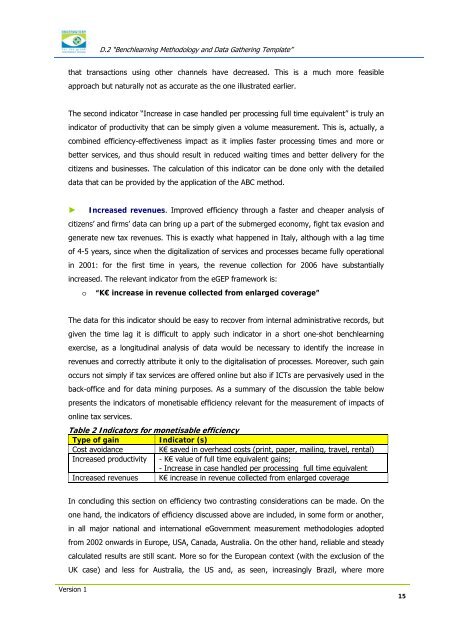
D.2 “<strong>Benchlearning</strong> Methodology <strong>and</strong> Data Gathering Template”that transactions using other channels have decreased. This is a much more feasibleapproach but naturally not as accurate as the one illustrated earlier.The second indicator “Increase in case h<strong>and</strong>led per processing full time equivalent” is truly anindicator of productivity that can be simply given a volume measurement. This is, actually, acombined efficiency-effectiveness impact as it implies faster processing times <strong>and</strong> more orbetter services, <strong>and</strong> thus should result in reduced waiting times <strong>and</strong> better delivery for thecitizens <strong>and</strong> businesses. The calculation of this indicator can be done only with the detailed<strong>data</strong> that can be provided by the application of the ABC method.► Increased revenues. Improved efficiency through a faster <strong>and</strong> cheaper analysis ofcitizens’ <strong>and</strong> firms’ <strong>data</strong> can bring up a part of the submerged economy, fight tax evasion <strong>and</strong>generate new tax revenues. This is exactly what happened in Italy, although with a lag timeof 4-5 years, since when the digitalization of services <strong>and</strong> processes became fully operationalin 2001: for the first time in years, the revenue collection for 2006 have substantiallyincreased. The relevant indicator from the eGEP framework is:o “K€ increase in revenue collected from enlarged coverage”The <strong>data</strong> for this indicator should be easy to recover from internal administrative records, butgiven the time lag it is difficult to apply such indicator in a short one-shot benchlearningexercise, as a longitudinal analysis of <strong>data</strong> would be necessary to identify the increase inrevenues <strong>and</strong> correctly attribute it only to the digitalisation of processes. Moreover, such gainoccurs not simply if tax services are offered online but also if ICTs are pervasively used in theback-office <strong>and</strong> for <strong>data</strong> mining purposes. As a summary of the discussion the table belowpresents the indicators of monetisable efficiency relevant for the measurement of impacts ofonline tax services.Table 2 Indicators for monetisable efficiencyType of gainIndicator (s)Cost avoidance K€ saved in overhead costs (print, paper, mailing, travel, rental)Increased productivity - K€ value of full time equivalent gains;- Increase in case h<strong>and</strong>led per processing full time equivalentIncreased revenues K€ increase in revenue collected from enlarged coverageIn concluding this section on efficiency two contrasting considerations can be made. On theone h<strong>and</strong>, the indicators of efficiency discussed above are included, in some form or another,in all major national <strong>and</strong> international eGovernment measurement methodologies adoptedfrom 2002 onwards in Europe, USA, Canada, Australia. On the other h<strong>and</strong>, reliable <strong>and</strong> steadycalculated results are still scant. More so for the European context (with the exclusion of theUK case) <strong>and</strong> less for Australia, the US <strong>and</strong>, as seen, increasingly Brazil, where moreVersion 115


