notes to the consolidated financial statements - Sacombank
notes to the consolidated financial statements - Sacombank
notes to the consolidated financial statements - Sacombank

Create successful ePaper yourself
Turn your PDF publications into a flip-book with our unique Google optimized e-Paper software.
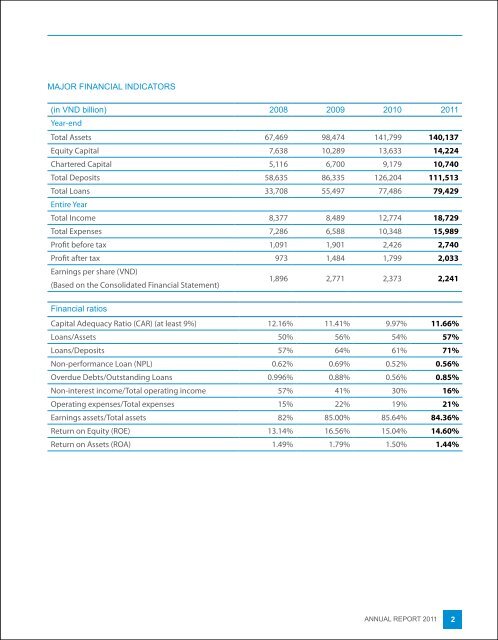
MAJOR FINANCIAL INDICATORS<br />
(in VND billion) 2008 2009 2010 2011<br />
Year-end<br />
Total Assets 67,469 98,474 141,799 140,137<br />
Equity Capital 7,638 10,289 13,633 14,224<br />
Chartered Capital 5,116 6,700 9,179 10,740<br />
Total Deposits 58,635 86,335 126,204 111,513<br />
Total Loans<br />
Entire Year<br />
33,708 55,497 77,486 79,429<br />
Total Income 8,377 8,489 12,774 18,729<br />
Total Expenses 7,286 6,588 10,348 15,989<br />
Profit before tax 1,091 1,901 2,426 2,740<br />
Profit after tax 973 1,484 1,799 2,033<br />
Earnings per share (VND)<br />
(Based on <strong>the</strong> Consolidated Financial Statement)<br />
1,896 2,771 2,373 2,241<br />
Financial ratios<br />
Capital Adequacy Ratio (CAR) (at least 9%) 12.16% 11.41% 9.97% 11.66%<br />
Loans/Assets 50% 56% 54% 57%<br />
Loans/Deposits 57% 64% 61% 71%<br />
Non-performance Loan (NPL) 0.62% 0.69% 0.52% 0.56%<br />
Overdue Debts/Outstanding Loans 0.996% 0.88% 0.56% 0.85%<br />
Non-interest income/Total operating income 57% 41% 30% 16%<br />
Operating expenses/Total expenses 15% 22% 19% 21%<br />
Earnings assets/Total assets 82% 85.00% 85.64% 84.36%<br />
Return on Equity (ROE) 13.14% 16.56% 15.04% 14.60%<br />
Return on Assets (ROA) 1.49% 1.79% 1.50% 1.44%<br />
ANNUAL REPORT 2011 2