Applied Superconductivity - Walther Meißner Institut - Bayerische ...
Applied Superconductivity - Walther Meißner Institut - Bayerische ...
Applied Superconductivity - Walther Meißner Institut - Bayerische ...
- No tags were found...

Create successful ePaper yourself
Turn your PDF publications into a flip-book with our unique Google optimized e-Paper software.
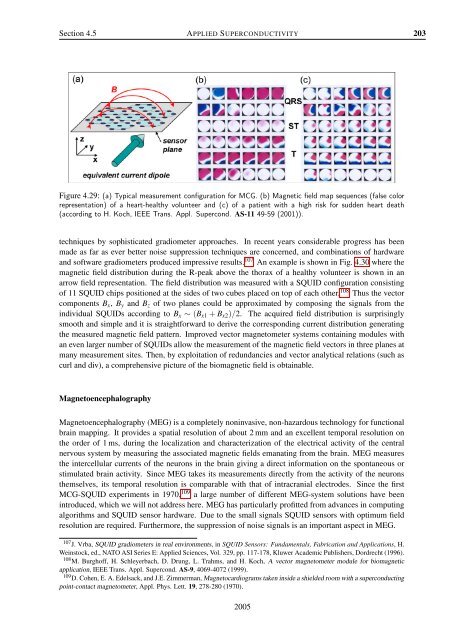
Section 4.5 APPLIED SUPERCONDUCTIVITY 203Figure 4.29: (a) Typical measurement configuration for MCG. (b) Magnetic field map sequences (false colorrepresentation) of a heart-healthy volunteer and (c) of a patient with a high risk for sudden heart death(according to H. Koch, IEEE Trans. Appl. Supercond. AS-11 49-59 (2001)).techniques by sophisticated gradiometer approaches. In recent years considerable progress has beenmade as far as ever better noise suppression techniques are concerned, and combinations of hardwareand software gradiometers produced impressive results. 107 An example is shown in Fig. 4.30 where themagnetic field distribution during the R-peak above the thorax of a healthy volunteer is shown in anarrow field representation. The field distribution was measured with a SQUID configuration consistingof 11 SQUID chips positioned at the sides of two cubes placed on top of each other. 108 Thus the vectorcomponents B x , B y and B z of two planes could be approximated by composing the signals from theindividual SQUIDs according to B x ∼ (B x1 + B x2 )/2. The acquired field distribution is surprisinglysmooth and simple and it is straightforward to derive the corresponding current distribution generatingthe measured magnetic field pattern. Improved vector magnetometer systems containing modules withan even larger number of SQUIDs allow the measurement of the magnetic field vectors in three planes atmany measurement sites. Then, by exploitation of redundancies and vector analytical relations (such ascurl and div), a comprehensive picture of the biomagnetic field is obtainable.MagnetoencephalographyMagnetoencephalography (MEG) is a completely noninvasive, non-hazardous technology for functionalbrain mapping. It provides a spatial resolution of about 2 mm and an excellent temporal resolution onthe order of 1 ms, during the localization and characterization of the electrical activity of the centralnervous system by measuring the associated magnetic fields emanating from the brain. MEG measuresthe intercellular currents of the neurons in the brain giving a direct information on the spontaneous orstimulated brain activity. Since MEG takes its measurements directly from the activity of the neuronsthemselves, its temporal resolution is comparable with that of intracranial electrodes. Since the firstMCG-SQUID experiments in 1970, 109 a large number of different MEG-system solutions have beenintroduced, which we will not address here. MEG has particularly profitted from advances in computingalgorithms and SQUID sensor hardware. Due to the small signals SQUID sensors with optimum fieldresolution are required. Furthermore, the suppression of noise signals is an important aspect in MEG.107 J. Vrba, SQUID gradiometers in real environments, in SQUID Sensors: Fundamentals, Fabrication and Applications, H.Weinstock, ed., NATO ASI Series E: <strong>Applied</strong> Sciences, Vol. 329, pp. 117-178, Kluwer Academic Publishers, Dordrecht (1996).108 M. Burghoff, H. Schleyerbach, D. Drung, L. Trahms, and H. Koch, A vector magnetometer module for biomagneticapplication, IEEE Trans. Appl. Supercond. AS-9, 4069-4072 (1999).109 D. Cohen, E. A. Edelsack, and J.E. Zimmerman, Magnetocardiograms taken inside a shielded room with a superconductingpoint-contact magnetometer, Appl. Phys. Lett. 19, 278-280 (1970).2005