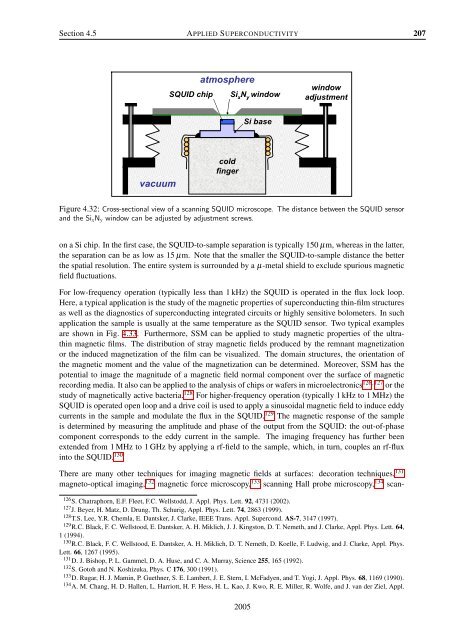
206 R. GROSS AND A. MARX Chapter 4aircraft maintenance hangar or a factory.NDE with SQUIDs can also be used for the detection of magnetic fields generated by specimens containingmagnetized components. 117 Furthermore, by scanning samples of steel one can explore the correlationbetween mechanical stress and magnetic-field distribution. This represents a unique probe ofthe mechanical or thermal stress to which a sample has been subjected. For example, it was shown thatSQUID sensors based on second-order electronic gradiometers can be used to detect ferrous inclusionsin the disks of turbine engine rotors. 118 In an other application a dc SQUID magnetometer was used todetect fine magnetic particles in a rapidly moving copper wire. The nitrogen-cooled SQUID was surroundedby a magnetic shield and the wire was pulled through holes in the shield about 15 mm belowthe SQUID sensor at speeds of 10 to 500 m/min. Iron particles as small as 50 µm in diameter could bedetected. The goal of this technique is to locate impurities that make the wire brittle, causing it to break.Fortunately, most NDE applications do not require the highest sensitivity of SQUID sensors, since theNyquist noise generated by the sample can be of the order of 1 pT/ √ Hz. However, this noise level is stillmuch lower than that of coil systems conventionally used for eddy current NDE. Thus, NDE applicationsbased in particular on high-T c SQUIDs are very promising.4.5.3 SQUID MicroscopyScanning SQUID microscopy (SSM) is a modern technique capable of imaging the magnetic field distributionin close proximity across the surface of a sample under investigation with high sensitivity andmodest spatial resolution. It is based on a thin-film SQUID sensor. Initially, scanning SQUID microscopeswere based on low-T c dc-SQUIDs and have been used to image static magnetic fields with acombination of high field and spatial resolution. 119,120 Shortly afterwards, high-T c SQUID microscopeshave been developed, in which the sample could be either at 77 K or at room temperature. 121,122,123,124Most often, the sample is moved over the SQUID in a two-dimensional scanning process and the magneticsignal is plotted versus the coordinate to produce an image. The frequency at which the image isobtained ranges from near zero, where simply the static magnetic field produced by the sample is measured,to beyond 1 GHz. Today SQUID microscopes with cold samples have a spatial resolution of about5 µm, while those with room temperature samples have a resolution ranging between 30 and 50 µm. Arecent innovation has dramatically improved the spatial resolution for cold samples, albeit at the price ofreduced magnetic field sensitivity. A soft magnetic tip is used to focus the flux from the sample into theSQUID resulting in a spatial resolution of the order of 0.1 µm. 125Fig. 4.32 shows a SQUID microscope, in which the sample is kept at room temperature. The SQUID ismounted in vacuum at the upper end of a sapphire rod (cold finger), the lower end of which is cooled byliquid nitrogen. Superinsulation surrounding the rod ensures that the temperature gradient along the rodis negligible. The SQUID is separated from the room temperature part and atmospheric pressure by athin window, which may be either a 75 µm thick sapphire disk or a 3 µm thick Si x N y window fabricated117 G.B. Donaldson, S. Evanson, M. Otaka, K. Hasegawa, T. Shimizu, and K. Takaku, Br. J. Non-Destr. Test. 32, 238 (1990).118 Y. Tavrin, M. Siegel, and J. Hinken, 1999, IEEE Trans. Appl. Supercond. AS-9, 3809 (1999).119 A. Mathai, D. Song, Y. Gim, and F. C. Wellstood, IEEE Trans. Appl. Supercond. AS-3, 2609 (1993).120 C.C. Tsuei, J. R. Kirtley, C. C. Chi, L. S. Yu-Jahnes, A. Gupta, T. Shaw, J. Z. Sun, and M. B. Ketchen, Phys. Rev. Lett. 73,593 (1994).121 R.C. Black, A. Mathai, F. C. Wellstood, E. Dantsker, A. H. Miklich, D. T. Nemeth, J. J. Kingston, and J. Clarke, Appl.Phys. Lett. 62, 2128 (1993).122 R.C. Black,F. C. Wellstood, E. Dantsker, A. H. Miklich, D. Kölle, F. Ludwig, and J. Clarke, IEEE Trans. Appl. Supercond.AS-5, 2137 (1995).123 T.S. Lee, E. Dantsker, and J. Clarke, Rev. Sci. Instrum. 67, 4208 (1996).124 T.S. Lee, Y. R. Chemla, E. Dantsker, and J. Clarke, IEEE Trans. Appl. Supercond. AS-7, 3147 (1997).125 P. Pitzius, V. Dworak, and U. Hartmann, in Extended Abstracts of the 6th International Superconductive Electronics Conference(ISEC’97), H. Koch and S. Knappe eds., Physikalisch-Technische Bundesanstalt, Berlin, Vol. 3, (1997), p. 395.© <strong>Walther</strong>-Meißner-<strong>Institut</strong>
Section 4.5 APPLIED SUPERCONDUCTIVITY 207SQUID chipatmosphereSi x N y windowwindowadjustmentSi basevacuumcoldfingerFigure 4.32: Cross-sectional view of a scanning SQUID microscope. The distance between the SQUID sensorand the Si x N y window can be adjusted by adjustment screws.on a Si chip. In the first case, the SQUID-to-sample separation is typically 150 µm, whereas in the latter,the separation can be as low as 15 µm. Note that the smaller the SQUID-to-sample distance the betterthe spatial resolution. The entire system is surrounded by a µ-metal shield to exclude spurious magneticfield fluctuations.For low-frequency operation (typically less than 1 kHz) the SQUID is operated in the flux lock loop.Here, a typical application is the study of the magnetic properties of superconducting thin-film structuresas well as the diagnostics of superconducting integrated circuits or highly sensitive bolometers. In suchapplication the sample is usually at the same temperature as the SQUID sensor. Two typical examplesare shown in Fig. 4.33. Furthermore, SSM can be applied to study magnetic properties of the ultrathinmagnetic films. The distribution of stray magnetic fields produced by the remnant magnetizationor the induced magnetization of the film can be visualized. The domain structures, the orientation ofthe magnetic moment and the value of the magnetization can be determined. Moreover, SSM has thepotential to image the magnitude of a magnetic field normal component over the surface of magneticrecording media. It also can be applied to the analysis of chips or wafers in microelectronics 126,127 or thestudy of magnetically active bacteria. 128 For higher-frequency operation (typically 1 kHz to 1 MHz) theSQUID is operated open loop and a drive coil is used to apply a sinusoidal magnetic field to induce eddycurrents in the sample and modulate the flux in the SQUID. 129 The magnetic response of the sampleis determined by measuring the amplitude and phase of the output from the SQUID: the out-of-phasecomponent corresponds to the eddy current in the sample. The imaging frequency has further beenextended from 1 MHz to 1 GHz by applying a rf-field to the sample, which, in turn, couples an rf-fluxinto the SQUID. 130There are many other techniques for imaging magnetic fields at surfaces: decoration techniques, 131magneto-optical imaging, 132 magnetic force microscopy, 133 scanning Hall probe microscopy, 134 scan-126 S. Chatraphorn, E.F. Fleet, F.C. Wellstodd, J. Appl. Phys. Lett. 92, 4731 (2002).127 J. Beyer, H. Matz, D. Drung, Th. Schurig, Appl. Phys. Lett. 74, 2863 (1999).128 T.S. Lee, Y.R. Chemla, E. Dantsker, J. Clarke, IEEE Trans. Appl. Supercond. AS-7, 3147 (1997).129 R.C. Black, F. C. Wellstood, E. Dantsker, A. H. Miklich, J. J. Kingston, D. T. Nemeth, and J. Clarke, Appl. Phys. Lett. 64,1 (1994).130 R.C. Black, F. C. Wellstood, E. Dantsker, A. H. Miklich, D. T. Nemeth, D. Koelle, F. Ludwig, and J. Clarke, Appl. Phys.Lett. 66, 1267 (1995).131 D. J. Bishop, P. L. Gammel, D. A. Huse, and C. A. Murray, Science 255, 165 (1992).132 S. Gotoh and N. Koshizuka, Phys. C 176, 300 (1991).133 D. Rugar, H. J. Mamin, P. Guethner, S. E. Lambert, J. E. Stern, I. McFadyen, and T. Yogi, J. Appl. Phys. 68, 1169 (1990).134 A. M. Chang, H. D. Hallen, L. Harriott, H. F. Hess, H. L. Kao, J. Kwo, R. E. Miller, R. Wolfe, and J. van der Ziel, Appl.2005