CORRAL PETROLEUM HOLDINGS AB (PUBL) - Preem
CORRAL PETROLEUM HOLDINGS AB (PUBL) - Preem
CORRAL PETROLEUM HOLDINGS AB (PUBL) - Preem

You also want an ePaper? Increase the reach of your titles
YUMPU automatically turns print PDFs into web optimized ePapers that Google loves.
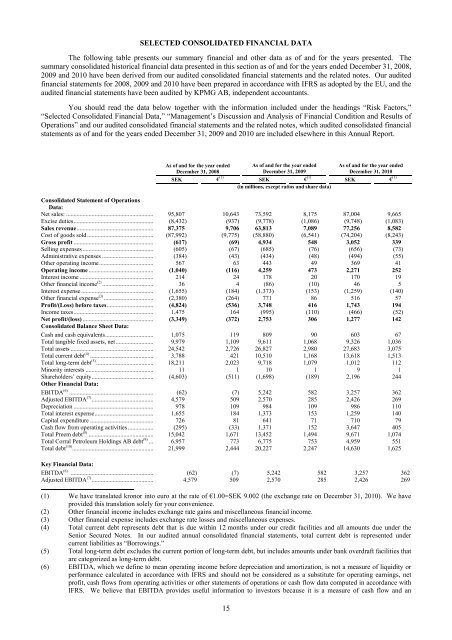
SELECTED CONSOLIDATED FINANCIAL DATAThe following table presents our summary financial and other data as of and for the years presented. Thesummary consolidated historical financial data presented in this section as of and for the years ended December 31, 2008,2009 and 2010 have been derived from our audited consolidated financial statements and the related notes. Our auditedfinancial statements for 2008, 2009 and 2010 have been prepared in accordance with IFRS as adopted by the EU, and theaudited financial statements have been audited by KPMG <strong>AB</strong>, independent accountants.You should read the data below together with the information included under the headings “Risk Factors,”“Selected Consolidated Financial Data,” “Management’s Discussion and Analysis of Financial Condition and Results ofOperations” and our audited consolidated financial statements and the related notes, which audited consolidated financialstatements as of and for the years ended December 31, 2009 and 2010 are included elsewhere in this Annual Report.As of and for the year endedDecember 31, 2008As of and for the year endedDecember 31, 2009As of and for the year endedDecember 31, 2010SEK € (1) SEK € (1) SEK € (1)(in millions, except ratios and share data)Consolidated Statement of OperationsData:Net sales: .......................................................... 95,807 10,643 73,592 8,175 87,004 9,665Excise duties..................................................... (8,432) (937) (9,778) (1,086) (9,748) (1,083)Sales revenue................................................... 87,375 9,706 63,813 7,089 77,256 8,582Cost of goods sold ............................................ (87,992) (9,775) (58,880) (6,541) (74,204) (8,243)Gross profit ..................................................... (617) (69) 4,934 548 3,052 339Selling expenses ............................................... (605) (67) (685) (76) (656) (73)Administrative expenses .................................. (384) (43) (434) (48) (494) (55)Other operating income.................................... 567 63 443 49 369 41Operating income ........................................... (1,040) (116) 4,259 473 2,271 252Interest income ................................................. 214 24 178 20 170 19Other financial income (2) .................................. 36 4 (86) (10) 46 5Interest expense ................................................ (1,655) (184) (1,373) (153) (1,259) (140)Other financial expense (3) ................................. (2,380) (264) 771 86 516 57Profit/(Loss) before taxes............................... (4,824) (536) 3,748 416 1,743 194Income taxes..................................................... 1,475 164 (995) (110) (466) (52)Net profit/(loss) ............................................... (3,349) (372) 2,753 306 1,277 142Consolidated Balance Sheet Data:Cash and cash equivalents................................ 1,075 119 809 90 603 67Total tangible fixed assets, net......................... 9,979 1,109 9,611 1,068 9,326 1,036Total assets ....................................................... 24,542 2,726 26,827 2,980 27,683 3,075Total current debt (4) .......................................... 3,788 421 10,510 1,168 13,618 1,513Total long-term debt (5) ...................................... 18,211 2,023 9,718 1,079 1,012 112Minority interests ............................................. 11 1 10 1 9 1Shareholders’ equity......................................... (4,603) (511) (1,698) (189) 2,196 244Other Financial Data:EBITDA (6) ........................................................ (62) (7) 5,242 582 3,257 362Adjusted EBITDA (7) ......................................... 4,579 509 2,570 285 2,426 269Depreciation ..................................................... 978 109 984 109 986 110Total interest expense....................................... 1,655 184 1,373 153 1,259 140Capital expenditure .......................................... 726 81 641 71 710 79Cash flow from operating activities ................. (295) (33) 1,371 152 3,647 405Total <strong>Preem</strong> debt (8) ........................................... 15,042 1,671 13,452 1,494 9,671 1,074Total Corral Petroleum Holdings <strong>AB</strong> debt (9) ... 6,957 773 6,775 753 4,959 551Total debt (10) ...................................................... 21,999 2,444 20,227 2,247 14,630 1,625Key Financial Data:EBITDA (6) ....................................................... (62) (7) 5,242 582 3,257 362Adjusted EBITDA (7) ......................................... 4,579 509 2,570 285 2,426 269(1) We have translated kronor into euro at the rate of €1.00=SEK 9.002 (the exchange rate on December 31, 2010). We haveprovided this translation solely for your convenience.(2) Other financial income includes exchange rate gains and miscellaneous financial income.(3) Other financial expense includes exchange rate losses and miscellaneous expenses.(4) Total current debt represents debt that is due within 12 months under our credit facilities and all amounts due under theSenior Secured Notes. In our audited annual consolidated financial statements, total current debt is represented undercurrent liabilities as “Borrowings.”(5) Total long-term debt excludes the current portion of long-term debt, but includes amounts under bank overdraft facilities thatare categorized as long-term debt.(6) EBITDA, which we define to mean operating income before depreciation and amortization, is not a measure of liquidity orperformance calculated in accordance with IFRS and should not be considered as a substitute for operating earnings, netprofit, cash flows from operating activities or other statements of operations or cash flow data computed in accordance withIFRS. We believe that EBITDA provides useful information to investors because it is a measure of cash flow and an15