SELECTED CONSOLIDATED FINANCIAL DATAThe following table presents our summary financial and other data as of and for the years presented. Thesummary consolidated historical financial data presented in this section as of and for the years ended December 31, 2008,2009 and 2010 have been derived from our audited consolidated financial statements and the related notes. Our auditedfinancial statements for 2008, 2009 and 2010 have been prepared in accordance with IFRS as adopted by the EU, and theaudited financial statements have been audited by KPMG <strong>AB</strong>, independent accountants.You should read the data below together with the information included under the headings “Risk Factors,”“Selected Consolidated Financial Data,” “Management’s Discussion and Analysis of Financial Condition and Results ofOperations” and our audited consolidated financial statements and the related notes, which audited consolidated financialstatements as of and for the years ended December 31, 2009 and 2010 are included elsewhere in this Annual Report.As of and for the year endedDecember 31, 2008As of and for the year endedDecember 31, 2009As of and for the year endedDecember 31, 2010SEK € (1) SEK € (1) SEK € (1)(in millions, except ratios and share data)Consolidated Statement of OperationsData:Net sales: .......................................................... 95,807 10,643 73,592 8,175 87,004 9,665Excise duties..................................................... (8,432) (937) (9,778) (1,086) (9,748) (1,083)Sales revenue................................................... 87,375 9,706 63,813 7,089 77,256 8,582Cost of goods sold ............................................ (87,992) (9,775) (58,880) (6,541) (74,204) (8,243)Gross profit ..................................................... (617) (69) 4,934 548 3,052 339Selling expenses ............................................... (605) (67) (685) (76) (656) (73)Administrative expenses .................................. (384) (43) (434) (48) (494) (55)Other operating income.................................... 567 63 443 49 369 41Operating income ........................................... (1,040) (116) 4,259 473 2,271 252Interest income ................................................. 214 24 178 20 170 19Other financial income (2) .................................. 36 4 (86) (10) 46 5Interest expense ................................................ (1,655) (184) (1,373) (153) (1,259) (140)Other financial expense (3) ................................. (2,380) (264) 771 86 516 57Profit/(Loss) before taxes............................... (4,824) (536) 3,748 416 1,743 194Income taxes..................................................... 1,475 164 (995) (110) (466) (52)Net profit/(loss) ............................................... (3,349) (372) 2,753 306 1,277 142Consolidated Balance Sheet Data:Cash and cash equivalents................................ 1,075 119 809 90 603 67Total tangible fixed assets, net......................... 9,979 1,109 9,611 1,068 9,326 1,036Total assets ....................................................... 24,542 2,726 26,827 2,980 27,683 3,075Total current debt (4) .......................................... 3,788 421 10,510 1,168 13,618 1,513Total long-term debt (5) ...................................... 18,211 2,023 9,718 1,079 1,012 112Minority interests ............................................. 11 1 10 1 9 1Shareholders’ equity......................................... (4,603) (511) (1,698) (189) 2,196 244Other Financial Data:EBITDA (6) ........................................................ (62) (7) 5,242 582 3,257 362Adjusted EBITDA (7) ......................................... 4,579 509 2,570 285 2,426 269Depreciation ..................................................... 978 109 984 109 986 110Total interest expense....................................... 1,655 184 1,373 153 1,259 140Capital expenditure .......................................... 726 81 641 71 710 79Cash flow from operating activities ................. (295) (33) 1,371 152 3,647 405Total <strong>Preem</strong> debt (8) ........................................... 15,042 1,671 13,452 1,494 9,671 1,074Total Corral Petroleum Holdings <strong>AB</strong> debt (9) ... 6,957 773 6,775 753 4,959 551Total debt (10) ...................................................... 21,999 2,444 20,227 2,247 14,630 1,625Key Financial Data:EBITDA (6) ....................................................... (62) (7) 5,242 582 3,257 362Adjusted EBITDA (7) ......................................... 4,579 509 2,570 285 2,426 269(1) We have translated kronor into euro at the rate of €1.00=SEK 9.002 (the exchange rate on December 31, 2010). We haveprovided this translation solely for your convenience.(2) Other financial income includes exchange rate gains and miscellaneous financial income.(3) Other financial expense includes exchange rate losses and miscellaneous expenses.(4) Total current debt represents debt that is due within 12 months under our credit facilities and all amounts due under theSenior Secured Notes. In our audited annual consolidated financial statements, total current debt is represented undercurrent liabilities as “Borrowings.”(5) Total long-term debt excludes the current portion of long-term debt, but includes amounts under bank overdraft facilities thatare categorized as long-term debt.(6) EBITDA, which we define to mean operating income before depreciation and amortization, is not a measure of liquidity orperformance calculated in accordance with IFRS and should not be considered as a substitute for operating earnings, netprofit, cash flows from operating activities or other statements of operations or cash flow data computed in accordance withIFRS. We believe that EBITDA provides useful information to investors because it is a measure of cash flow and an15
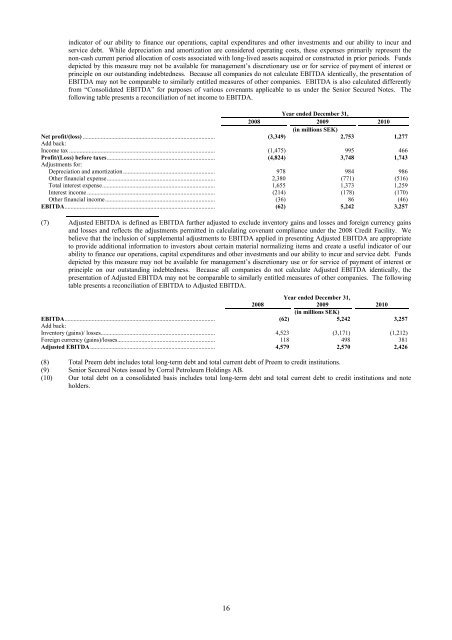
indicator of our ability to finance our operations, capital expenditures and other investments and our ability to incur andservice debt. While depreciation and amortization are considered operating costs, these expenses primarily represent thenon-cash current period allocation of costs associated with long-lived assets acquired or constructed in prior periods. Fundsdepicted by this measure may not be available for management’s discretionary use or for service of payment of interest orprinciple on our outstanding indebtedness. Because all companies do not calculate EBITDA identically, the presentation ofEBITDA may not be comparable to similarly entitled measures of other companies. EBITDA is also calculated differentlyfrom “Consolidated EBITDA” for purposes of various covenants applicable to us under the Senior Secured Notes. Thefollowing table presents a reconciliation of net income to EBITDA.Year ended December 31,2008 2009 2010(in millions SEK)Net profit/(loss) ........................................................................................ (3,349) 2,753 1,277Add back:Income tax ................................................................................................. (1,475) 995 466Profit/(Loss) before taxes........................................................................ (4,824) 3,748 1,743Adjustments for:Depreciation and amortization ............................................................. 978 984 986Other financial expense........................................................................ 2,380 (771) (516)Total interest expense........................................................................... 1,655 1,373 1,259Interest income ..................................................................................... (214) (178) (170)Other financial income......................................................................... (36) 86 (46)EBITDA.................................................................................................... (62) 5,242 3,257(7) Adjusted EBITDA is defined as EBITDA further adjusted to exclude inventory gains and losses and foreign currency gainsand losses and reflects the adjustments permitted in calculating covenant compliance under the 2008 Credit Facility. Webelieve that the inclusion of supplemental adjustments to EBITDA applied in presenting Adjusted EBITDA are appropriateto provide additional information to investors about certain material normalizing items and create a useful indicator of ourability to finance our operations, capital expenditures and other investments and our ability to incur and service debt. Fundsdepicted by this measure may not be available for management’s discretionary use or for service of payment of interest orprinciple on our outstanding indebtedness. Because all companies do not calculate Adjusted EBITDA identically, thepresentation of Adjusted EBITDA may not be comparable to similarly entitled measures of other companies. The followingtable presents a reconciliation of EBITDA to Adjusted EBITDA.Year ended December 31,2008 2009 2010(in millions SEK)EBITDA.................................................................................................... (62) 5,242 3,257Add back:Inventory (gains)/ losses............................................................................ 4,523 (3,171) (1,212)Foreign currency (gains)/losses................................................................. 118 498 381Adjusted EBITDA ................................................................................... 4,579 2,570 2,426(8) Total <strong>Preem</strong> debt includes total long-term debt and total current debt of <strong>Preem</strong> to credit institutions.(9) Senior Secured Notes issued by Corral Petroleum Holdings <strong>AB</strong>.(10) Our total debt on a consolidated basis includes total long-term debt and total current debt to credit institutions and noteholders.16
- Page 2: TABLE OF CONTENTSDisclosure Regardi
- Page 5: which was merged into Preem on Octo
- Page 8 and 9: RISK FACTORSThe risk factors below
- Page 10 and 11: the cost of exploring for, developi
- Page 12 and 13: purchase a minimum of 10% to 20% of
- Page 14 and 15: market price at the time of settlem
- Page 16 and 17: Notes, we would try to obtain waive
- Page 18 and 19: are reasonable grounds for believin
- Page 20 and 21: civil liability, whether or not pre
- Page 24 and 25: MANAGEMENT’S DISCUSSION AND ANALY
- Page 26 and 27: Year ended December 31,%2008 2009 C
- Page 28 and 29: arrel in February, increased to app
- Page 30 and 31: (1) Includes sales by our supply an
- Page 32 and 33: SEK 5,519 million, from a loss of S
- Page 34 and 35: Cash flow used in investment activi
- Page 36 and 37: Restrictions on transfers of fundsW
- Page 38 and 39: Variable rate debt—amount due .
- Page 40 and 41: As of December 31, 2008, SEK 21,999
- Page 42 and 43: Our StrengthsOur competitive streng
- Page 44 and 45: Lysekil has a total storage capacit
- Page 46 and 47: Unfinished and Blend Stocks........
- Page 48 and 49: Heating Oil .......................
- Page 50 and 51: Business-to-Business DivisionWe pre
- Page 52 and 53: “.nu,” “.org,” “.biz,”
- Page 54 and 55: Energy AB, Huda Trading AB, the Swe
- Page 56 and 57: was incorporated on March 22, 2007,
- Page 58 and 59: RELATED PARTY TRANSACTIONSCapital T
- Page 60 and 61: DESCRIPTION OF CERTAIN INDEBTEDNESS
- Page 62 and 63: effected by the Third Supplemental
- Page 64 and 65: first ranking mortgage certificates
- Page 66 and 67: LEGAL INFORMATIONCorral Petroleum H
- Page 68 and 69: CORRAL PETROLEUM HOLDINGS AB (publ)
- Page 70 and 71: CORRAL PETROLEUM HOLDINGS AB (publ)
- Page 72 and 73:
CORRAL PETROLEUM HOLDINGS AB (publ)
- Page 74 and 75:
CORRAL PETROLEUM HOLDINGS AB (publ)
- Page 76 and 77:
SubsidiariesSubsidiaries are compan
- Page 78 and 79:
The refinery installations consist
- Page 80 and 81:
of occupational pension insurance,
- Page 82 and 83:
Emission rights 2010LysekilGothenbu
- Page 84 and 85:
NOTE 2. FINANCIAL RISK MANAGEMENTTh
- Page 86 and 87:
In addition to price risk managemen
- Page 88 and 89:
The fair value of borrowing is calc
- Page 90 and 91:
Reconciliation with the Group’s t
- Page 92 and 93:
The Board members including the Cha
- Page 94 and 95:
NOTE 12. EXPENSES BROKEN DOWN BY TY
- Page 96 and 97:
NOTE 16. EXCHANGE RATE DIFFERENCES
- Page 98 and 99:
Equipment, tools, fixtures and fitt
- Page 100 and 101:
NOTE 23. TRADE AND OTHER RECEIVABLE
- Page 102 and 103:
The change in the fair value of pla
- Page 104 and 105:
Loan conditions, effective interest
- Page 106 and 107:
Capitalized interest cost..........
- Page 108:
SalesDecember 31, 2009AccountsPurch