CORRAL PETROLEUM HOLDINGS AB (PUBL) - Preem
CORRAL PETROLEUM HOLDINGS AB (PUBL) - Preem
CORRAL PETROLEUM HOLDINGS AB (PUBL) - Preem

You also want an ePaper? Increase the reach of your titles
YUMPU automatically turns print PDFs into web optimized ePapers that Google loves.
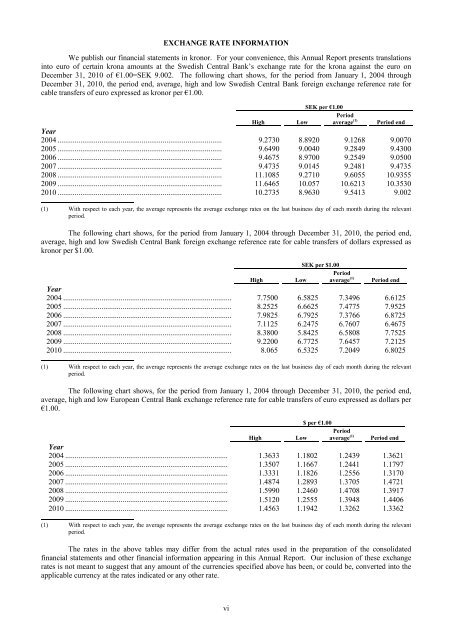
EXCHANGE RATE INFORMATIONWe publish our financial statements in kronor. For your convenience, this Annual Report presents translationsinto euro of certain krona amounts at the Swedish Central Bank’s exchange rate for the krona against the euro onDecember 31, 2010 of €1.00=SEK 9.002. The following chart shows, for the period from January 1, 2004 throughDecember 31, 2010, the period end, average, high and low Swedish Central Bank foreign exchange reference rate forcable transfers of euro expressed as kronor per €1.00.HighSEK per €1.00PeriodLow average (1)Period endYear2004 ...................................................................................... 9.2730 8.8920 9.1268 9.00702005 ...................................................................................... 9.6490 9.0040 9.2849 9.43002006 ...................................................................................... 9.4675 8.9700 9.2549 9.05002007 ...................................................................................... 9.4735 9.0145 9.2481 9.47352008 ...................................................................................... 11.1085 9.2710 9.6055 10.93552009 ...................................................................................... 11.6465 10.057 10.6213 10.35302010 ...................................................................................... 10.2735 8.9630 9.5413 9.002(1) With respect to each year, the average represents the average exchange rates on the last business day of each month during the relevantperiod.The following chart shows, for the period from January 1, 2004 through December 31, 2010, the period end,average, high and low Swedish Central Bank foreign exchange reference rate for cable transfers of dollars expressed askronor per $1.00.HighSEK per $1.00PeriodLow average (1)Period endYear2004 ......................................................................................... 7.7500 6.5825 7.3496 6.61252005 ......................................................................................... 8.2525 6.6625 7.4775 7.95252006 ......................................................................................... 7.9825 6.7925 7.3766 6.87252007 ......................................................................................... 7.1125 6.2475 6.7607 6.46752008 ......................................................................................... 8.3800 5.8425 6.5808 7.75252009 ......................................................................................... 9.2200 6.7725 7.6457 7.21252010 ......................................................................................... 8.065 6.5325 7.2049 6.8025(1) With respect to each year, the average represents the average exchange rates on the last business day of each month during the relevantperiod.The following chart shows, for the period from January 1, 2004 through December 31, 2010, the period end,average, high and low European Central Bank exchange reference rate for cable transfers of euro expressed as dollars per€1.00.High$ per €1.00PeriodLow average (1)Period endYear2004 ...................................................................................... 1.3633 1.1802 1.2439 1.36212005 ...................................................................................... 1.3507 1.1667 1.2441 1.17972006 ...................................................................................... 1.3331 1.1826 1.2556 1.31702007 ...................................................................................... 1.4874 1.2893 1.3705 1.47212008 ...................................................................................... 1.5990 1.2460 1.4708 1.39172009 ...................................................................................... 1.5120 1.2555 1.3948 1.44062010 ...................................................................................... 1.4563 1.1942 1.3262 1.3362(1) With respect to each year, the average represents the average exchange rates on the last business day of each month during the relevantperiod.The rates in the above tables may differ from the actual rates used in the preparation of the consolidatedfinancial statements and other financial information appearing in this Annual Report. Our inclusion of these exchangerates is not meant to suggest that any amount of the currencies specified above has been, or could be, converted into theapplicable currency at the rates indicated or any other rate.vi