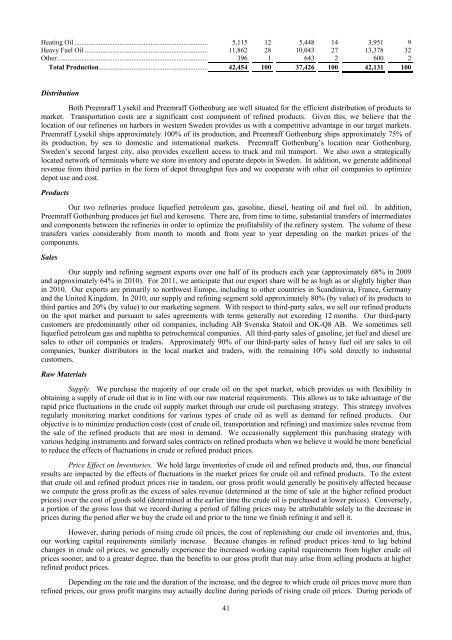
Heating Oil ............................................................................. 5,115 12 5,448 14 3,951 9Heavy Fuel Oil ....................................................................... 11,862 28 10,043 27 13,378 32Other....................................................................................... 396 1 643 2 600 2Total Production............................................................... 42,454 100 37,426 100 42,131 100DistributionBoth <strong>Preem</strong>raff Lysekil and <strong>Preem</strong>raff Gothenburg are well situated for the efficient distribution of products tomarket. Transportation costs are a significant cost component of refined products. Given this, we believe that thelocation of our refineries on harbors in western Sweden provides us with a competitive advantage in our target markets.<strong>Preem</strong>raff Lysekil ships approximately 100% of its production, and <strong>Preem</strong>raff Gothenburg ships approximately 75% ofits production, by sea to domestic and international markets. <strong>Preem</strong>raff Gothenburg’s location near Gothenburg,Sweden’s second largest city, also provides excellent access to truck and rail transport. We also own a strategicallylocated network of terminals where we store inventory and operate depots in Sweden. In addition, we generate additionalrevenue from third parties in the form of depot throughput fees and we cooperate with other oil companies to optimizedepot use and cost.ProductsOur two refineries produce liquefied petroleum gas, gasoline, diesel, heating oil and fuel oil. In addition,<strong>Preem</strong>raff Gothenburg produces jet fuel and kerosene. There are, from time to time, substantial transfers of intermediatesand components between the refineries in order to optimize the profitability of the refinery system. The volume of thesetransfers varies considerably from month to month and from year to year depending on the market prices of thecomponents.SalesOur supply and refining segment exports over one half of its products each year (approximately 68% in 2009and approximately 64% in 2010). For 2011, we anticipate that our export share will be as high as or slightly higher thanin 2010. Our exports are primarily to northwest Europe, including to other countries in Scandinavia, France, Germanyand the United Kingdom. In 2010, our supply and refining segment sold approximately 80% (by value) of its products tothird parties and 20% (by value) to our marketing segment. With respect to third-party sales, we sell our refined productson the spot market and pursuant to sales agreements with terms generally not exceeding 12 months. Our third-partycustomers are predominantly other oil companies, including <strong>AB</strong> Svenska Statoil and OK-Q8 <strong>AB</strong>. We sometimes sellliquefied petroleum gas and naphtha to petrochemical companies. All third-party sales of gasoline, jet fuel and diesel aresales to other oil companies or traders. Approximately 90% of our third-party sales of heavy fuel oil are sales to oilcompanies, bunker distributors in the local market and traders, with the remaining 10% sold directly to industrialcustomers.Raw MaterialsSupply. We purchase the majority of our crude oil on the spot market, which provides us with flexibility inobtaining a supply of crude oil that is in line with our raw material requirements. This allows us to take advantage of therapid price fluctuations in the crude oil supply market through our crude oil purchasing strategy. This strategy involvesregularly monitoring market conditions for various types of crude oil as well as demand for refined products. Ourobjective is to minimize production costs (cost of crude oil, transportation and refining) and maximize sales revenue fromthe sale of the refined products that are most in demand. We occasionally supplement this purchasing strategy withvarious hedging instruments and forward sales contracts on refined products when we believe it would be more beneficialto reduce the effects of fluctuations in crude or refined product prices.Price Effect on Inventories. We hold large inventories of crude oil and refined products and, thus, our financialresults are impacted by the effects of fluctuations in the market prices for crude oil and refined products. To the extentthat crude oil and refined product prices rise in tandem, our gross profit would generally be positively affected becausewe compute the gross profit as the excess of sales revenue (determined at the time of sale at the higher refined productprices) over the cost of goods sold (determined at the earlier time the crude oil is purchased at lower prices). Conversely,a portion of the gross loss that we record during a period of falling prices may be attributable solely to the decrease inprices during the period after we buy the crude oil and prior to the time we finish refining it and sell it.However, during periods of rising crude oil prices, the cost of replenishing our crude oil inventories and, thus,our working capital requirements similarly increase. Because changes in refined product prices tend to lag behindchanges in crude oil prices, we generally experience the increased working capital requirements from higher crude oilprices sooner, and to a greater degree, than the benefits to our gross profit that may arise from selling products at higherrefined product prices.Depending on the rate and the duration of the increase, and the degree to which crude oil prices move more thanrefined prices, our gross profit margins may actually decline during periods of rising crude oil prices. During periods of41
declining crude oil prices, we believe that we experience the opposite effects. Both the crude oil market and the refinedproducts market are volatile.We believe that, although the price effect on inventories may impact our results for a given period, over thelong-term, the effects of rising and falling oil prices tend to offset each other. In addition we believe that, from a cashflow perspective, the effects of rising and falling oil prices on gross profit and working capital tend to offset each other.Therefore, in comparing our results from period to period, we believe that it is important to note that these price effectson inventories are unrelated to, and do not reflect, the underlying efficiency of the refineries. See also “Management’sDiscussion and Analysis of Financial Condition and Results of Operations—Quantitative and Qualitative Disclosuresabout Market Risk—Commodity Price Risk.”Inventory Management. We employ several strategies to minimize the impact on our profitability of thevolatility in feedstock costs and refined product prices. Our inventory management strategies include the purchase andsale of exchange-related, oil-related futures and options with a duration of 12 months or less. To a lesser extent, we alsouse oil swap agreements similar to those traded on international exchanges such as the ICE Futures Europe, includingcrack spreads and crude oil options that, because they contain certain terms customized to the market in which we sell,such as point of delivery, are better suited to hedge against the specific price movements in our markets. The number ofbarrels of crude oil and refined products covered by such contracts varies from time to time. Nevertheless, we seek tomaintain our “normal position” of crude oil, finished products and intermediates. Our “normal position,” which is1,840,000 cubic meters (approximately 12 million barrels), is evaluated based on the average optimal inventory level inour depot system, the required inventory levels to allow for continuous flow and operations and the amount of crude oiland products that are priced, but not delivered. When the volume in our inventories deviates from the normal position,both above and below, we have used and will seek to use derivatives to restore the volume that is exposed to pricefluctuations. These strategies are designed to minimize, on a short-term basis, our exposure to the risk of fluctuations incrude oil prices and refined product margins. This hedging activity is closely managed and subject to internallyestablished risk standards. The results of these hedging activities are recognized in our financial statements asadjustments to the cost of goods sold. To the extent permitted under our financing arrangements, we participate to asmall degree in “contango” trading in connection with our inventory management. “Contango” occurs when the forwardprices of crude oil or refined products exceed current spot market prices. As a result of our large storage capacity, we areable to take advantage of the price curve being in contango by simultaneously entering into current spot market purchasesand future sale agreements. By locking in our margin, we can realize significant profits by utilizing our substantialstorage facilities to store crude oil and refined products at our existing facilities until the delivery date called for by thesale agreements.StorageWe own a strategically located network of storage depots along the Swedish coastline. Currently, our sixstorage depots have a total storage capacity of 935,000 cubic meters (approximately 5.9 million barrels). Of the totalstorage capacity at our depots, approximately 30% is leased out, which generated SEK 25 million of rental income fromthird parties during 2010. Pursuant to EU and Swedish legislations, we are required to keep certain levels of compulsorystorage at our refineries and depots. However, our current inventory exceeds these minimum requirements and, thus, alsoenables us to earn income by selling certificates for storage capacity to other oil companies for their EU-imposedcompulsory storage obligations. Total storage capacity at our refineries is approximately 4,500,000 cubic meters, ofwhich currently approximately 300,000 to 400,000 cubic meters are leased out to third parties. In addition, we havepotential additional storage capacity at Aspedalen, next to our Lysekil refinery, which could increase our storage capacityby 1,800,000 cubic meters (approximately 11 million barrels). However, this additional storage capacity would requiresubstantial capital investments, which we do not expect to make in the near future. In 2010, we generated SEK 95.2million (€10.6 million) in the sale of storage certificates.Marketing OperationsThe marketing segment resells refined products in Sweden. Our marketing segment consists of two divisions: abusiness-to-business division that sells to large- and medium-sized commercial customers and independent dealers and astation and consumer division that sells our gasoline and diesel through approximately 390 <strong>Preem</strong> branded manned andunmanned service stations, which are company owned and dealer operated, along with approximately 180 companyownedSåifa branded diesel truck stops. Our marketing segment had sales revenue of SEK 16,822 million (€1,869million), SEK 13,702 million (€1,522 million) and SEK 16,140 million (€1,793 million) and operating income of SEK349 million (€39 million), operating income of SEK 213 million (€24 million) and operating loss of SEK 6 million (€1million) for the years ended December 31, 2010, 2009 and 2008, respectively. In 2008, approximately 17% (by value) ofthe products made by our supply and refining segment was sold to our marketing segment, and the other 83% (by value)was sold to third parties. In 2009, approximately 19% (by value) of the products made by our supply and refiningsegment was sold to our marketing segment, and the other 81% (by value) was sold to third parties. In 2010,approximately 20% (by value) of the products made by our supply and refining segment was sold to our marketingsegment, and the other 80% (by value) was sold to third parties.42
- Page 2: TABLE OF CONTENTSDisclosure Regardi
- Page 5: which was merged into Preem on Octo
- Page 8 and 9: RISK FACTORSThe risk factors below
- Page 10 and 11: the cost of exploring for, developi
- Page 12 and 13: purchase a minimum of 10% to 20% of
- Page 14 and 15: market price at the time of settlem
- Page 16 and 17: Notes, we would try to obtain waive
- Page 18 and 19: are reasonable grounds for believin
- Page 20 and 21: civil liability, whether or not pre
- Page 22 and 23: SELECTED CONSOLIDATED FINANCIAL DAT
- Page 24 and 25: MANAGEMENT’S DISCUSSION AND ANALY
- Page 26 and 27: Year ended December 31,%2008 2009 C
- Page 28 and 29: arrel in February, increased to app
- Page 30 and 31: (1) Includes sales by our supply an
- Page 32 and 33: SEK 5,519 million, from a loss of S
- Page 34 and 35: Cash flow used in investment activi
- Page 36 and 37: Restrictions on transfers of fundsW
- Page 38 and 39: Variable rate debt—amount due .
- Page 40 and 41: As of December 31, 2008, SEK 21,999
- Page 42 and 43: Our StrengthsOur competitive streng
- Page 44 and 45: Lysekil has a total storage capacit
- Page 46 and 47: Unfinished and Blend Stocks........
- Page 50 and 51: Business-to-Business DivisionWe pre
- Page 52 and 53: “.nu,” “.org,” “.biz,”
- Page 54 and 55: Energy AB, Huda Trading AB, the Swe
- Page 56 and 57: was incorporated on March 22, 2007,
- Page 58 and 59: RELATED PARTY TRANSACTIONSCapital T
- Page 60 and 61: DESCRIPTION OF CERTAIN INDEBTEDNESS
- Page 62 and 63: effected by the Third Supplemental
- Page 64 and 65: first ranking mortgage certificates
- Page 66 and 67: LEGAL INFORMATIONCorral Petroleum H
- Page 68 and 69: CORRAL PETROLEUM HOLDINGS AB (publ)
- Page 70 and 71: CORRAL PETROLEUM HOLDINGS AB (publ)
- Page 72 and 73: CORRAL PETROLEUM HOLDINGS AB (publ)
- Page 74 and 75: CORRAL PETROLEUM HOLDINGS AB (publ)
- Page 76 and 77: SubsidiariesSubsidiaries are compan
- Page 78 and 79: The refinery installations consist
- Page 80 and 81: of occupational pension insurance,
- Page 82 and 83: Emission rights 2010LysekilGothenbu
- Page 84 and 85: NOTE 2. FINANCIAL RISK MANAGEMENTTh
- Page 86 and 87: In addition to price risk managemen
- Page 88 and 89: The fair value of borrowing is calc
- Page 90 and 91: Reconciliation with the Group’s t
- Page 92 and 93: The Board members including the Cha
- Page 94 and 95: NOTE 12. EXPENSES BROKEN DOWN BY TY
- Page 96 and 97: NOTE 16. EXCHANGE RATE DIFFERENCES
- Page 98 and 99:
Equipment, tools, fixtures and fitt
- Page 100 and 101:
NOTE 23. TRADE AND OTHER RECEIVABLE
- Page 102 and 103:
The change in the fair value of pla
- Page 104 and 105:
Loan conditions, effective interest
- Page 106 and 107:
Capitalized interest cost..........
- Page 108:
SalesDecember 31, 2009AccountsPurch