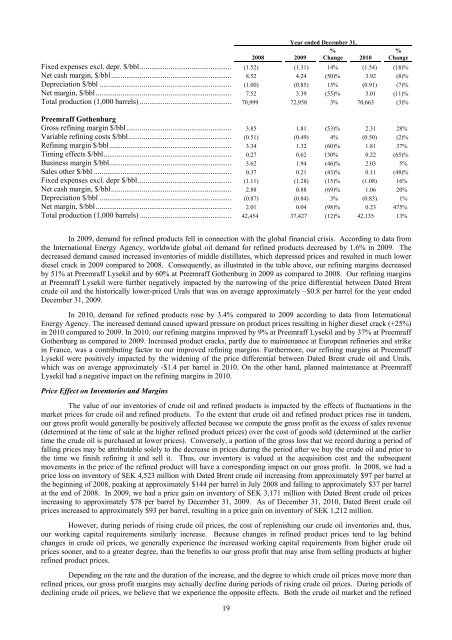
Year ended December 31,%2008 2009 Change 2010%ChangeFixed expenses excl. depr. $/bbl................................................ (1.52) (1.31) 14% (1.54) (18)%Net cash margin, $/bbl............................................................... 8.52 4.24 (50)% 3.92 (8)%Depreciation $/bbl ..................................................................... (1.00) (0.85) 15% (0.91) (7)%Net margin, $/bbl....................................................................... 7.52 3.39 (55)% 3.01 (11)%Total production (1,000 barrels) ................................................ 70,999 72,958 3% 70,663 (3)%<strong>Preem</strong>raff GothenburgGross refining margin $/bbl....................................................... 3.85 1.81 (53)% 2.31 28%Variable refining costs $/bbl...................................................... (0.51) (0.49) 4% (0.50) (2)%Refining margin $/bbl................................................................ 3.34 1.32 (60)% 1.81 37%Timing effects $/bbl................................................................... 0.27 0.62 130% 0.22 (65)%Business margin $/bbl................................................................ 3.62 1.94 (46)% 2.03 5%Sales other $/bbl ........................................................................ 0.37 0.21 (43)% 0.11 (48)%Fixed expenses excl. depr $/bbl................................................. (1.11) (1.28) (15)% (1.08) 16%Net cash margin, $/bbl............................................................... 2.88 0.88 (69)% 1.06 20%Depreciation $/bbl ..................................................................... (0.87) (0.84) 3% (0.83) 1%Net margin, $/bbl....................................................................... 2.01 0.04 (98)% 0.23 475%Total production (1,000 barrels) ................................................ 42,454 37,427 (12)% 42,135 13%In 2009, demand for refined products fell in connection with the global financial crisis. According to data fromthe International Energy Agency, worldwide global oil demand for refined products decreased by 1.6% in 2009. Thedecreased demand caused increased inventories of middle distillates, which depressed prices and resulted in much lowerdiesel crack in 2009 compared to 2008. Consequently, as illustrated in the table above, our refining margins decreasedby 51% at <strong>Preem</strong>raff Lysekil and by 60% at <strong>Preem</strong>raff Gothenburg in 2009 as compared to 2008. Our refining marginsat <strong>Preem</strong>raff Lysekil were further negatively impacted by the narrowing of the price differential between Dated Brentcrude oil and the historically lower-priced Urals that was on average approximately –$0.8 per barrel for the year endedDecember 31, 2009.In 2010, demand for refined products rose by 3.4% compared to 2009 according to data from InternationalEnergy Agency. The increased demand caused upward pressure on product prices resulting in higher diesel crack (+25%)in 2010 compared to 2009. In 2010, our refining margins improved by 9% at <strong>Preem</strong>raff Lysekil and by 37% at <strong>Preem</strong>raffGothenburg as compared to 2009. Increased product cracks, partly due to maintenance at European refineries and strikein France, was a contributing factor to our improved refining margins. Furthermore, our refining margins at <strong>Preem</strong>raffLysekil were positively impacted by the widening of the price differential between Dated Brent crude oil and Urals,which was on average approximately -$1.4 per barrel in 2010. On the other hand, planned maintenance at <strong>Preem</strong>raffLysekil had a negative impact on the refining margins in 2010.Price Effect on Inventories and MarginsThe value of our inventories of crude oil and refined products is impacted by the effects of fluctuations in themarket prices for crude oil and refined products. To the extent that crude oil and refined product prices rise in tandem,our gross profit would generally be positively affected because we compute the gross profit as the excess of sales revenue(determined at the time of sale at the higher refined product prices) over the cost of goods sold (determined at the earliertime the crude oil is purchased at lower prices). Conversely, a portion of the gross loss that we record during a period offalling prices may be attributable solely to the decrease in prices during the period after we buy the crude oil and prior tothe time we finish refining it and sell it. Thus, our inventory is valued at the acquisition cost and the subsequentmovements in the price of the refined product will have a corresponding impact on our gross profit. In 2008, we had aprice loss on inventory of SEK 4,523 million with Dated Brent crude oil increasing from approximately $97 per barrel atthe beginning of 2008, peaking at approximately $144 per barrel in July 2008 and falling to approximately $37 per barrelat the end of 2008. In 2009, we had a price gain on inventory of SEK 3,171 million with Dated Brent crude oil pricesincreasing to approximately $78 per barrel by December 31, 2009. As of December 31, 2010, Dated Brent crude oilprices increased to approximately $93 per barrel, resulting in a price gain on inventory of SEK 1,212 million.However, during periods of rising crude oil prices, the cost of replenishing our crude oil inventories and, thus,our working capital requirements similarly increase. Because changes in refined product prices tend to lag behindchanges in crude oil prices, we generally experience the increased working capital requirements from higher crude oilprices sooner, and to a greater degree, than the benefits to our gross profit that may arise from selling products at higherrefined product prices.Depending on the rate and the duration of the increase, and the degree to which crude oil prices move more thanrefined prices, our gross profit margins may actually decline during periods of rising crude oil prices. During periods ofdeclining crude oil prices, we believe that we experience the opposite effects. Both the crude oil market and the refined19
products markets are volatile.We believe that, although the price effect on inventories may impact our results for a given period, over thelong-term, the effects of rising and falling oil prices tend to offset each other. In addition we believe that, from a cashflow perspective, the effects of rising and falling oil prices on gross profit and working capital tend to offset each other.In comparing our results from period to period, we believe that it is important to note that these price effects oninventories are unrelated to, and do not reflect, the underlying efficiency of the refineries. We strive to minimize theimpact on our profitability of the volatility in feedstock costs and refined product prices. See “Business—Supply andRefining Operations—Raw Materials” and “—Quantitative and Qualitative Disclosures about Market Risk—CommodityPrice Risk.”Fluctuations in Foreign Currency Exchange RatesOur financial condition and results of operations are exposed to two types of risk related to foreign currencyexchange rates, specifically translation risk and transaction risk. We are exposed to translation risk because a significantpercentage of our sales and expenses are realized and incurred in currencies other than the krona, which is our reportingcurrency. We are also exposed to translation risk because certain of our assets and liabilities are denominated incurrencies other than the krona. We are exposed to transaction risk because our revenues and costs are denominated inboth the dollar and the krona.Translation RiskRevenues and Expenses. Substantial portions of our revenues and expenses are recorded in dollars and thentranslated into kronor for inclusion in our financial statements. Thus, a decline in the value of the dollar against the kronawill have a negative effect on our revenues as reported in kronor, that is, the krona value of our dollar-denominatedrevenues will decline. Conversely, an increase in the value of the dollar against the krona will have a negative effect onour expenses as reported in kronor, that is, the krona value of our dollar-denominated expenses will increase.Inventory. In the course of our ordinary operations, we store significant amounts of crude oil and refinedproducts, the value of which is denominated in dollars because market prices for crude oil and refined products aretypically denominated in dollars. Our total inventories, which are accounted for as part of our current assets, were SEK8,216 million as of December 31, 2010. A decrease in the value of the dollar against the krona will result in a decrease inthe value of our inventories, when expressed in kronor. Foreign exchange gains or losses on our inventory are includedas part of cost of goods sold.Indebtedness. As of December 31, 2010, approximately 30% of our debt was denominated in dollars, 20% wasdenominated in euros and 50% was denominated in kronor. As a result, a decrease in the value of the dollar against thekrona will result in a decrease in the krona value of our dollar-denominated indebtedness. Conversely, an increase in thevalue of the dollar against the krona will result in an increase in the krona value of our dollar-denominated indebtedness.Foreign exchange gains or losses on our indebtedness are included as part of financial expense, net.Transaction riskWe are exposed to transaction risk because our revenues and expenses are denominated in both kronor anddollars. Accordingly, the relative movements of the krona/dollar exchange rate can significantly affect our results ofoperations. For example, an appreciation of the krona against the dollar may adversely affect our margins to the extentthat our krona-denominated revenues do not cover our krona-denominated expenses. This risk is reduced by matchingsales revenues and expenses in the same currency, which is generally the practice in our industry given the percentage ofpurchase and sales contracts that are denominated in dollars.In addition, we are exposed to transaction risk in connection with our accounts payable for crude oil purchases.If the dollar changes in value against the krona between the date of purchase and the date of payment, the difference inthe krona value of our payment and the krona value of the account payable would be recorded as a foreign exchange gainor loss in our results of operations. We face a similar risk with respect to our accounts receivable for refined productsales.Trend InformationExchange rates. The value of the dollar against both the krona and the euro decreased in 2008. In 2009, thevalue of the dollar against the krona increased by approximately 7% and the value of the dollar against the eurodecreased by approximately 4%. In 2010, the value of the dollar against the krona decreased by approximately 6% andthe value of the dollar against the euro increased by approximately 8%. See “—Fluctuations in Foreign CurrencyExchange Rates—Translation Risk.”Volatile crude oil prices. During 2008, the strong upward trend in Dated Brent crude oil prices continued withonly short-term dips during the first half of 2008, peaking at approximately $144 per barrel in July. Prices fellsignificantly in the second half of the year, reaching a low of approximately $34 per barrel in December and ending theyear at approximately $37 per barrel. During 2009, Dated Brent crude oil prices reached a low of approximately $40 per20
- Page 2: TABLE OF CONTENTSDisclosure Regardi
- Page 5: which was merged into Preem on Octo
- Page 8 and 9: RISK FACTORSThe risk factors below
- Page 10 and 11: the cost of exploring for, developi
- Page 12 and 13: purchase a minimum of 10% to 20% of
- Page 14 and 15: market price at the time of settlem
- Page 16 and 17: Notes, we would try to obtain waive
- Page 18 and 19: are reasonable grounds for believin
- Page 20 and 21: civil liability, whether or not pre
- Page 22 and 23: SELECTED CONSOLIDATED FINANCIAL DAT
- Page 24 and 25: MANAGEMENT’S DISCUSSION AND ANALY
- Page 28 and 29: arrel in February, increased to app
- Page 30 and 31: (1) Includes sales by our supply an
- Page 32 and 33: SEK 5,519 million, from a loss of S
- Page 34 and 35: Cash flow used in investment activi
- Page 36 and 37: Restrictions on transfers of fundsW
- Page 38 and 39: Variable rate debt—amount due .
- Page 40 and 41: As of December 31, 2008, SEK 21,999
- Page 42 and 43: Our StrengthsOur competitive streng
- Page 44 and 45: Lysekil has a total storage capacit
- Page 46 and 47: Unfinished and Blend Stocks........
- Page 48 and 49: Heating Oil .......................
- Page 50 and 51: Business-to-Business DivisionWe pre
- Page 52 and 53: “.nu,” “.org,” “.biz,”
- Page 54 and 55: Energy AB, Huda Trading AB, the Swe
- Page 56 and 57: was incorporated on March 22, 2007,
- Page 58 and 59: RELATED PARTY TRANSACTIONSCapital T
- Page 60 and 61: DESCRIPTION OF CERTAIN INDEBTEDNESS
- Page 62 and 63: effected by the Third Supplemental
- Page 64 and 65: first ranking mortgage certificates
- Page 66 and 67: LEGAL INFORMATIONCorral Petroleum H
- Page 68 and 69: CORRAL PETROLEUM HOLDINGS AB (publ)
- Page 70 and 71: CORRAL PETROLEUM HOLDINGS AB (publ)
- Page 72 and 73: CORRAL PETROLEUM HOLDINGS AB (publ)
- Page 74 and 75: CORRAL PETROLEUM HOLDINGS AB (publ)
- Page 76 and 77:
SubsidiariesSubsidiaries are compan
- Page 78 and 79:
The refinery installations consist
- Page 80 and 81:
of occupational pension insurance,
- Page 82 and 83:
Emission rights 2010LysekilGothenbu
- Page 84 and 85:
NOTE 2. FINANCIAL RISK MANAGEMENTTh
- Page 86 and 87:
In addition to price risk managemen
- Page 88 and 89:
The fair value of borrowing is calc
- Page 90 and 91:
Reconciliation with the Group’s t
- Page 92 and 93:
The Board members including the Cha
- Page 94 and 95:
NOTE 12. EXPENSES BROKEN DOWN BY TY
- Page 96 and 97:
NOTE 16. EXCHANGE RATE DIFFERENCES
- Page 98 and 99:
Equipment, tools, fixtures and fitt
- Page 100 and 101:
NOTE 23. TRADE AND OTHER RECEIVABLE
- Page 102 and 103:
The change in the fair value of pla
- Page 104 and 105:
Loan conditions, effective interest
- Page 106 and 107:
Capitalized interest cost..........
- Page 108:
SalesDecember 31, 2009AccountsPurch


