arrel in February, increased to approximately $75 per barrel in August and ended the year at approximately $78 perbarrel. In 2010, Dated Brent crude oil prices ended the year at approximately $93 per barrel. Prices are expected toremain volatile in the future.Margin outlook. Industry margins may be volatile in the future, depending primarily on price movements forcrude oil and refined products, international political and economic developments.Shift in refined product demand towards biofuels. Legislation and regulations, including with respect to taxationof refined products, have been implemented all over Europe, with Sweden in the forefront. The overall effect of suchlegislation has been the production of more environmentally-friendly products. An increase in transit commercial trafficand a growing trend to switch from gasoline to diesel cars in Western Europe has contributed to the increased demand forlow-sulphur diesel. Furthermore, consumers have also begun to shift towards alternative heating sources. Thus, weanticipate that the demand for heating oil will continue to decrease, and, ultimately, that the market for heating oil fordomestic heating will disappear. We are well-positioned to respond to these shifts in the demand for refined products bypursuing biofuel growth opportunities, which are accompanied by the added benefit of tax incentives. See “Business—Sustainable Business Initiatives.” For example, during the first quarter of 2010, we shut down our mild hydrocracker at<strong>Preem</strong>raff Gothenburg for two months (until May 2010) in order to modify the unit to partly process renewablefeedstock, which enables us to produce biofuel diesel, and we have decreased our production of heating oil at <strong>Preem</strong>raffLysekil, a lower-margin product, and increased our production of virtually sulphur-free (10 parts per million) diesel, ahigher-margin product, which has improved our overall refining margins.Consolidation. Over the past several years, the Swedish oil refinery industry has experienced noticeableconsolidation as a result of industry mergers and acquisitions. The consolidation has reduced the number of competitorsoperating in the marketplace.Explanation of Key Income Statement ItemsNet SalesOur net sales include excise duties, which are taxes on petroleum products that we collect at the point of saleand remit monthly, primarily to the Swedish government. The continuous collection of excise duties at the time of saleand the holding of such excise duties until we are obligated to remit them to the government enables us to use this cash tofund a significant portion of our working capital needs.Sales RevenueSales revenue represents our net sales less the excise duties. Sales revenue also includes foreign exchange gainsor losses on our accounts receivable. In this discussion, we have provided sales revenue figures for our supply andrefining segment and our marketing segment. The sales revenue of our supply and refining segment includesinter-company sales to the marketing segment and the sales revenue of our marketing segment includes the sales revenuereceived on the resale of such refined products. The inter-company sales between our supply and refining segment andour marketing segment are made at market rates. Since refined products are commodities, these sales could have beenmade to third parties at similar prices. We believe that the inclusion of these amounts in the sales revenue for our supplyand refining segment properly reflects the results of these segments for purposes of comparison. These inter-companysales have been eliminated in our annual audited consolidated financial statements.Cost of Goods SoldCost of goods sold consists of the cost of our crude oil and other feedstock purchases (including transportationcosts) and direct production costs (including depreciation of equipment used in the refining process). Cost of goods soldalso includes foreign exchange gains or losses on our inventory and our accounts payable. We rely primarily on spotmarket purchases. We regularly monitor market conditions for various types of crude oil as well as demand for refinedproducts.Gross Profit/(Loss)Gross profit/(loss) is our sales revenue less the cost of goods sold.Selling and Administrative ExpensesSelling and administrative expenses consist primarily of the costs of sales and administrative personnel,advertising and promotions.Other Operating IncomeOther operating income consists of our sales of surplus heat, harbor fees, sales of storage certificates to other oilcompanies for their EU-imposed compulsory storage obligations, income from the rental of dealer-operated servicestations and several other items, none of which is individually material. Our other operating income is largely21
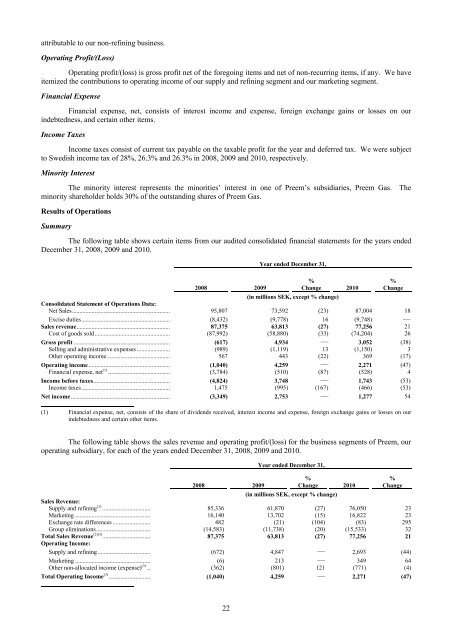
attributable to our non-refining business.Operating Profit/(Loss)Operating profit/(loss) is gross profit net of the foregoing items and net of non-recurring items, if any. We haveitemized the contributions to operating income of our supply and refining segment and our marketing segment.Financial ExpenseFinancial expense, net, consists of interest income and expense, foreign exchange gains or losses on ourindebtedness, and certain other items.Income TaxesIncome taxes consist of current tax payable on the taxable profit for the year and deferred tax. We were subjectto Swedish income tax of 28%, 26.3% and 26.3% in 2008, 2009 and 2010, respectively.Minority InterestThe minority interest represents the minorities’ interest in one of <strong>Preem</strong>’s subsidiaries, <strong>Preem</strong> Gas. Theminority shareholder holds 30% of the outstanding shares of <strong>Preem</strong> Gas.Results of OperationsSummaryThe following table shows certain items from our audited consolidated financial statements for the years endedDecember 31, 2008, 2009 and 2010.Year ended December 31,%Change 20102008 2009(in millions SEK, except % change)%ChangeConsolidated Statement of Operations Data:Net Sales................................................................. 95,807 73,592 (23) 87,004 18Excise duties........................................................... (8,432) (9,778) 16 (9,748) —Sales revenue.............................................................. 87,375 63,813 (27) 77,256 21Cost of goods sold.................................................. (87,992) (58,880) (33) (74,204) 26Gross profit ................................................................ (617) 4,934 — 3,052 (38)Selling and administrative expenses ...................... (989) (1,119) 13 (1,150) 3Other operating income.......................................... 567 443 (22) 369 (17)Operating income ...................................................... (1,040) 4,259 — 2,271 (47)Financial expense, net (1) ......................................... (3,784) (510) (87) (528) 4Income before taxes................................................... (4,824) 3,748 — 1,743 (53)Income taxes........................................................... 1,475 (995) (167) (466) (53)Net income.................................................................. (3,349) 2,753 — 1,277 54(1) Financial expense, net, consists of the share of dividends received, interest income and expense, foreign exchange gains or losses on ourindebtedness and certain other items.The following table shows the sales revenue and operating profit/(loss) for the business segments of <strong>Preem</strong>, ouroperating subsidiary, for each of the years ended December 31, 2008, 2009 and 2010.Year ended December 31,%Change 20102008 2009(in millions SEK, except % change)%ChangeSales Revenue:Supply and refining (1) ................................ 85,336 61,870 (27) 76,050 23Marketing .................................................. 16,140 13,702 (15) 16,822 23Exchange rate differences ......................... 482 (21) (104) (83) 295Group eliminations.................................... (14,583) (11,738) (20) (15,533) 32Total Sales Revenue (2)(3) ................................ 87,375 63,813 (27) 77,256 21Operating Income:Supply and refining ................................... (672) 4,847 — 2,693 (44)Marketing .................................................. (6) 213 — 349 64Other non-allocated income (expense) (3) .. (362) (801) 121 (771) (4)Total Operating Income (3) ............................ (1,040) 4,259 — 2,271 (47)22
- Page 2: TABLE OF CONTENTSDisclosure Regardi
- Page 5: which was merged into Preem on Octo
- Page 8 and 9: RISK FACTORSThe risk factors below
- Page 10 and 11: the cost of exploring for, developi
- Page 12 and 13: purchase a minimum of 10% to 20% of
- Page 14 and 15: market price at the time of settlem
- Page 16 and 17: Notes, we would try to obtain waive
- Page 18 and 19: are reasonable grounds for believin
- Page 20 and 21: civil liability, whether or not pre
- Page 22 and 23: SELECTED CONSOLIDATED FINANCIAL DAT
- Page 24 and 25: MANAGEMENT’S DISCUSSION AND ANALY
- Page 26 and 27: Year ended December 31,%2008 2009 C
- Page 30 and 31: (1) Includes sales by our supply an
- Page 32 and 33: SEK 5,519 million, from a loss of S
- Page 34 and 35: Cash flow used in investment activi
- Page 36 and 37: Restrictions on transfers of fundsW
- Page 38 and 39: Variable rate debt—amount due .
- Page 40 and 41: As of December 31, 2008, SEK 21,999
- Page 42 and 43: Our StrengthsOur competitive streng
- Page 44 and 45: Lysekil has a total storage capacit
- Page 46 and 47: Unfinished and Blend Stocks........
- Page 48 and 49: Heating Oil .......................
- Page 50 and 51: Business-to-Business DivisionWe pre
- Page 52 and 53: “.nu,” “.org,” “.biz,”
- Page 54 and 55: Energy AB, Huda Trading AB, the Swe
- Page 56 and 57: was incorporated on March 22, 2007,
- Page 58 and 59: RELATED PARTY TRANSACTIONSCapital T
- Page 60 and 61: DESCRIPTION OF CERTAIN INDEBTEDNESS
- Page 62 and 63: effected by the Third Supplemental
- Page 64 and 65: first ranking mortgage certificates
- Page 66 and 67: LEGAL INFORMATIONCorral Petroleum H
- Page 68 and 69: CORRAL PETROLEUM HOLDINGS AB (publ)
- Page 70 and 71: CORRAL PETROLEUM HOLDINGS AB (publ)
- Page 72 and 73: CORRAL PETROLEUM HOLDINGS AB (publ)
- Page 74 and 75: CORRAL PETROLEUM HOLDINGS AB (publ)
- Page 76 and 77: SubsidiariesSubsidiaries are compan
- Page 78 and 79:
The refinery installations consist
- Page 80 and 81:
of occupational pension insurance,
- Page 82 and 83:
Emission rights 2010LysekilGothenbu
- Page 84 and 85:
NOTE 2. FINANCIAL RISK MANAGEMENTTh
- Page 86 and 87:
In addition to price risk managemen
- Page 88 and 89:
The fair value of borrowing is calc
- Page 90 and 91:
Reconciliation with the Group’s t
- Page 92 and 93:
The Board members including the Cha
- Page 94 and 95:
NOTE 12. EXPENSES BROKEN DOWN BY TY
- Page 96 and 97:
NOTE 16. EXCHANGE RATE DIFFERENCES
- Page 98 and 99:
Equipment, tools, fixtures and fitt
- Page 100 and 101:
NOTE 23. TRADE AND OTHER RECEIVABLE
- Page 102 and 103:
The change in the fair value of pla
- Page 104 and 105:
Loan conditions, effective interest
- Page 106 and 107:
Capitalized interest cost..........
- Page 108:
SalesDecember 31, 2009AccountsPurch