MANAGEMENT’S DISCUSSION AND ANALYSIS OF FINANCIAL CONDITIONAND RESULTS OF OPERATIONSThe following is a discussion of our results of operations and financial condition for the years endedDecember 31, 2008, 2009 and 2010. The discussions regarding our results of operations are based on the auditedconsolidated financial statements as of and for the years ended December 31, 2008, 2009 and 2010.You should read this discussion in conjunction with our audited annual consolidated financial statements and therelated notes, which audited consolidated financial statements as of and for the years ended December 31, 2009 and 2010are included elsewhere in this Annual Report. We have prepared our audited annual consolidated financial statements inaccordance with IFRS as adopted by the EU. The following analysis contains forward-looking statements about futurerevenue, operating results and expectations that involve risks and uncertainties. Our actual results could differ materiallyfrom those anticipated in the forward-looking statements as a result of numerous factors, including the risks discussed in“Risk Factors” and elsewhere in this Annual Report.Overview of the BusinessWe are the largest oil refining company in the Nordic region in terms of capacity. We conduct our businessthrough our wholly owned operating company, <strong>Preem</strong>, which operates its business through two segments, a supply andrefining segment and a marketing segment. We refine crude oil in Sweden and then market and sell refined productsprimarily in Sweden and other northwestern European markets, including Scandinavia, France, Germany and the UnitedKingdom, as well as the United States and, to a lesser extent, other markets. Our refineries represented approximately80% of the refining capacity in Sweden and approximately 30% of the refining capacity in the Nordic region in 2010.We sell more refined products in Sweden than any of our competitors. In Sweden, we had the leading market share in2010 in terms of sales volume of diesel, heating oil and fuel oil with approximately 35% of diesel sales, 49% of heatingoil sales and 52% of fuel oil sales, according to the Swedish Statistical Central Bureau. In addition, our marketingsegment’s share of the Swedish retail gasoline and diesel markets in terms of sales volume were approximately 12% and25%, respectively, in 2010, based on data from the Swedish Statistical Central Bureau.Our supply and refining segment purchases and refines crude oil and then sells refined products wholesale to ourmarketing segment and to third parties. We also own a strategically located network of storage depots in Sweden. In2010, our supply and refining segment sold approximately 80% (by value) of its products to third parties and 20% (byvalue) to our marketing segment as compared to 81% (by value) and 19% (by value), respectively, in 2009. Our supplyand refining segment had sales revenue of SEK 76,050 million (€8,448 million), SEK 61,870 million (€6,873 million)and SEK 85,336 million (€9,480 million) and operating income of SEK 2,693 million (€299 million), operating incomeof SEK 4,847 million (€538 million) and operating loss of SEK 672 million (€75 million) for the years ended December31, 2010, 2009 and 2008, respectively. Our marketing segment consists of two divisions: a business-to-business divisionand a station and consumer division. The marketing segment resells refined products, wholesale, primarily in Sweden.We also sell our gasoline and diesel through approximately 390 <strong>Preem</strong>-branded manned and unmanned service stations,which are company-owned and dealer-operated, along with approximately 180 company-owned Såifa-branded dieseltruck stops. Our marketing segment had sales revenue of SEK 16,822 million (€1,869 million), SEK 13,702 million(€1,522 million) and SEK 16,140 million (€1,793 million) and operating income of SEK 349 million (€39 million),operating income of SEK 213 million (€24 million) and operating loss of SEK 6 million (€1 million) for the years endedDecember 31, 2010, 2009 and 2008, respectively.Key Factors Affecting Results of Operationsfactors.Our results of operations during the period under consideration have been primarily affected by the followingRefining MarginsOil refineries measure the financial performance of their operations by their margins. Prices for crude oil andrefined products are subject to frequent and significant fluctuations. As a result, a refinery’s sales revenue and cost ofgoods sold can vary significantly from period to period, even when the volume of crude oil purchased and refinedproducts sold remain relatively constant. A refinery’s sales revenue depends on refined product prices, currencyfluctuations and throughput, which is a function of refining capacity and utilization. The cyclicality of refined productprices results in high volatility of sales revenue. Consequently, sales revenue, viewed alone, is not indicative of an oilrefining company’s results. Earnings and cash flow from refining are largely driven by gross and net margins, and asuccessful refinery strives to maintain its profit margins from year to year, notwithstanding fluctuations in the prices ofcrude oil and refined products. See “Business—Supply and Refining Operations—Raw Materials” and “—Quantitativeand Qualitative Disclosures about Market Risk—Commodity Price Risk.”“Gross refining margin” is the difference between the sales revenue received from the sale of refined productsproduced by a refinery and the cost of crude oil and (where relevant) other intermediate feedstocks processed by it.17
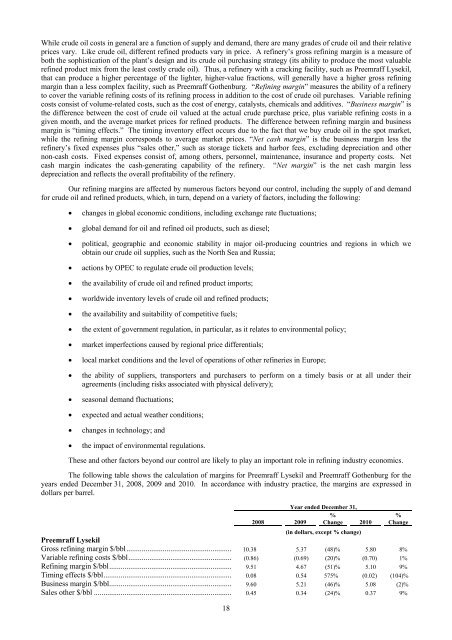
While crude oil costs in general are a function of supply and demand, there are many grades of crude oil and their relativeprices vary. Like crude oil, different refined products vary in price. A refinery’s gross refining margin is a measure ofboth the sophistication of the plant’s design and its crude oil purchasing strategy (its ability to produce the most valuablerefined product mix from the least costly crude oil). Thus, a refinery with a cracking facility, such as <strong>Preem</strong>raff Lysekil,that can produce a higher percentage of the lighter, higher-value fractions, will generally have a higher gross refiningmargin than a less complex facility, such as <strong>Preem</strong>raff Gothenburg. “Refining margin” measures the ability of a refineryto cover the variable refining costs of its refining process in addition to the cost of crude oil purchases. Variable refiningcosts consist of volume-related costs, such as the cost of energy, catalysts, chemicals and additives. “Business margin” isthe difference between the cost of crude oil valued at the actual crude purchase price, plus variable refining costs in agiven month, and the average market prices for refined products. The difference between refining margin and businessmargin is “timing effects.” The timing inventory effect occurs due to the fact that we buy crude oil in the spot market,while the refining margin corresponds to average market prices. “Net cash margin” is the business margin less therefinery’s fixed expenses plus “sales other,” such as storage tickets and harbor fees, excluding depreciation and othernon-cash costs. Fixed expenses consist of, among others, personnel, maintenance, insurance and property costs. Netcash margin indicates the cash-generating capability of the refinery. “Net margin” is the net cash margin lessdepreciation and reflects the overall profitability of the refinery.Our refining margins are affected by numerous factors beyond our control, including the supply of and demandfor crude oil and refined products, which, in turn, depend on a variety of factors, including the following:changes in global economic conditions, including exchange rate fluctuations;global demand for oil and refined oil products, such as diesel;political, geographic and economic stability in major oil-producing countries and regions in which weobtain our crude oil supplies, such as the North Sea and Russia;actions by OPEC to regulate crude oil production levels;the availability of crude oil and refined product imports;worldwide inventory levels of crude oil and refined products;the availability and suitability of competitive fuels;the extent of government regulation, in particular, as it relates to environmental policy;market imperfections caused by regional price differentials;local market conditions and the level of operations of other refineries in Europe;the ability of suppliers, transporters and purchasers to perform on a timely basis or at all under theiragreements (including risks associated with physical delivery);seasonal demand fluctuations;expected and actual weather conditions;changes in technology; andthe impact of environmental regulations.These and other factors beyond our control are likely to play an important role in refining industry economics.The following table shows the calculation of margins for <strong>Preem</strong>raff Lysekil and <strong>Preem</strong>raff Gothenburg for theyears ended December 31, 2008, 2009 and 2010. In accordance with industry practice, the margins are expressed indollars per barrel.18Year ended December 31,%2008 2009 Change 2010(in dollars, except % change)%Change<strong>Preem</strong>raff LysekilGross refining margin $/bbl....................................................... 10.38 5.37 (48)% 5.80 8%Variable refining costs $/bbl...................................................... (0.86) (0.69) (20)% (0.70) 1%Refining margin $/bbl................................................................ 9.51 4.67 (51)% 5.10 9%Timing effects $/bbl................................................................... 0.08 0.54 575% (0.02) (104)%Business margin $/bbl................................................................ 9.60 5.21 (46)% 5.08 (2)%Sales other $/bbl ........................................................................ 0.45 0.34 (24)% 0.37 9%
- Page 2: TABLE OF CONTENTSDisclosure Regardi
- Page 5: which was merged into Preem on Octo
- Page 8 and 9: RISK FACTORSThe risk factors below
- Page 10 and 11: the cost of exploring for, developi
- Page 12 and 13: purchase a minimum of 10% to 20% of
- Page 14 and 15: market price at the time of settlem
- Page 16 and 17: Notes, we would try to obtain waive
- Page 18 and 19: are reasonable grounds for believin
- Page 20 and 21: civil liability, whether or not pre
- Page 22 and 23: SELECTED CONSOLIDATED FINANCIAL DAT
- Page 26 and 27: Year ended December 31,%2008 2009 C
- Page 28 and 29: arrel in February, increased to app
- Page 30 and 31: (1) Includes sales by our supply an
- Page 32 and 33: SEK 5,519 million, from a loss of S
- Page 34 and 35: Cash flow used in investment activi
- Page 36 and 37: Restrictions on transfers of fundsW
- Page 38 and 39: Variable rate debt—amount due .
- Page 40 and 41: As of December 31, 2008, SEK 21,999
- Page 42 and 43: Our StrengthsOur competitive streng
- Page 44 and 45: Lysekil has a total storage capacit
- Page 46 and 47: Unfinished and Blend Stocks........
- Page 48 and 49: Heating Oil .......................
- Page 50 and 51: Business-to-Business DivisionWe pre
- Page 52 and 53: “.nu,” “.org,” “.biz,”
- Page 54 and 55: Energy AB, Huda Trading AB, the Swe
- Page 56 and 57: was incorporated on March 22, 2007,
- Page 58 and 59: RELATED PARTY TRANSACTIONSCapital T
- Page 60 and 61: DESCRIPTION OF CERTAIN INDEBTEDNESS
- Page 62 and 63: effected by the Third Supplemental
- Page 64 and 65: first ranking mortgage certificates
- Page 66 and 67: LEGAL INFORMATIONCorral Petroleum H
- Page 68 and 69: CORRAL PETROLEUM HOLDINGS AB (publ)
- Page 70 and 71: CORRAL PETROLEUM HOLDINGS AB (publ)
- Page 72 and 73: CORRAL PETROLEUM HOLDINGS AB (publ)
- Page 74 and 75:
CORRAL PETROLEUM HOLDINGS AB (publ)
- Page 76 and 77:
SubsidiariesSubsidiaries are compan
- Page 78 and 79:
The refinery installations consist
- Page 80 and 81:
of occupational pension insurance,
- Page 82 and 83:
Emission rights 2010LysekilGothenbu
- Page 84 and 85:
NOTE 2. FINANCIAL RISK MANAGEMENTTh
- Page 86 and 87:
In addition to price risk managemen
- Page 88 and 89:
The fair value of borrowing is calc
- Page 90 and 91:
Reconciliation with the Group’s t
- Page 92 and 93:
The Board members including the Cha
- Page 94 and 95:
NOTE 12. EXPENSES BROKEN DOWN BY TY
- Page 96 and 97:
NOTE 16. EXCHANGE RATE DIFFERENCES
- Page 98 and 99:
Equipment, tools, fixtures and fitt
- Page 100 and 101:
NOTE 23. TRADE AND OTHER RECEIVABLE
- Page 102 and 103:
The change in the fair value of pla
- Page 104 and 105:
Loan conditions, effective interest
- Page 106 and 107:
Capitalized interest cost..........
- Page 108:
SalesDecember 31, 2009AccountsPurch