SEK 5,519 million, from a loss of SEK 672 million for the year ended December 31, 2008. This increase was primarily aresult of price gains on our inventories in 2009 in combination with the significant fall in market prices for crude oil andrefined products during the second half of 2008. Excluding price effects on inventory, our operating income amounted toSEK 1,089 million for the year ended December 31, 2009, a decrease of SEK 2,394 million from SEK 3,483 million forthe year ended December 31, 2008. The decrease in our operating income was primarily attributable to lower dieselmargins and a narrower spread between Dated Brent crude oil and heavy crude oil for the year ended December 31, 2009as compared to the year ended December 31, 2008. Our marketing segment generated an operating income of SEK 213million for the year ended December 31, 2009, an increase of SEK 219 million from an operating loss of SEK 6 millionfor the year ended December 31, 2008. The increase in the marketing segment’s operating income was primarily a resultof higher sales margins and sales volumes in our marketing operations.Financial expense, net. Our financial expense, net, for the year ended December 31, 2009 was SEK 510million, a decrease of SEK 3,274 million from SEK 3,784 million for the year ended December 31, 2008. Thisimprovement was mainly attributable to foreign exchange gains on our loans denominated in dollar and euro and, tosome extent, lower interest expense as a result of lower interest rates. For the year ended December 31, 2009, the foreignexchange gains amounted to SEK 838 million compared to a loss of SEK 2,099 million for the year ended December 31,2008. In 2009, interest expense amounted to SEK 1,373 million, a decrease of SEK 282 million from SEK 1,655 millionin 2008.Income taxes. Income taxes for the year ended December 31, 2009 were SEK 995 million, an increase of SEK2,470 million from SEK a tax benefit of 1,475 million for the year ended December 31, 2008. The increase was mainlyattributable to higher income before taxes for the year ended December 31, 2009 as compared to the year endedDecember 31, 2008.Net income. Net income for the year ended December 31, 2009 was SEK 2,753 million, an increase of SEK6,102 million from a loss of SEK 3,349 million for the year ended December 31, 2008 as a result of the factors discussedabove.Liquidity and capital resourcesOverviewOur primary cash requirements include purchase of feedstocks, upgrade and maintenance projects, servicingindebtedness, funding construction and general working capital needs. Our primary sources of liquidity are availablecash reserves, internal cash generation, long-term debt, short-term working capital financing and short-term use of exciseduties collected. We operate in an environment in which liquidity and capital resources are impacted by changes in theprices for crude oil and refined products, and a variety of additional risks, including currency and regulatory risks. Inparticular, because we purchase crude oil on the spot market and prices can be volatile, the availability of cash or shorttermcredit is crucial to our business. Historically, our cash and short-term credit have been sufficient to finance suchpurchases. As of December 31, 2008, 2009 and 2010, we had cash and cash equivalents of SEK 1,075 million(€119 million), SEK 809 million (€90 million), and SEK 603 million (€67 million), respectively. Our net debt(consisting of the 2008 Credit Facility and the Senior Secured Notes after reduction of cash and cash equivalents) wasSEK 14,027 million (€1,558 million) as of December 31, 2010. Our debt service obligations consist primarily of the2008 Credit Facility, the Senior Secured Notes and the Subordinated Notes. In line with our strategy to make focusedcapital expenditures, we expect to commit approximately SEK 1,000 million (€111 million) to capital expenditures in2011 primarily for planned maintenance turnaround costs at <strong>Preem</strong>raff Gothenburg, the relocation of the central controlhouse at <strong>Preem</strong>raff Lysekil and certain operational improvements, including investments in health, safety andenvironmental upgrades that are required under Swedish law.The 2008 Credit Facility matures on September 17, 2011 and the Senior Secured Notes mature on September18, 2011. We are considering a number of alternatives with respect to repayment or refinancing the Senior SecuredNotes and the 2008 Credit Facility. These upcoming maturities and the reversal of positive trends on our cash flows thatwe experienced in late 2010 due to purchasing levels returning to normal in the first quarter will impact our liquidity in2011. In connection with our analysis of potential refinancing alternatives for these upcoming maturities, we are alsofocusing on ways to improve our liquidity position in the coming months, including but not limited to preserving ourcash balances, in order to provide more flexibility to operate our business. There can be no assurance that we willaddress these issues in a timely manner, and as a result, our liquidity may be negatively impacted as we approach thesematurities. There can be no assurances that we will be able to repay or refinance the Senior Secured Notes or the 2008Credit Facility prior to their maturities. If we are unable to refinance or repay these obligations, the lenders and theholders of the Senior Secured Notes may proceed against the collateral securing these obligations, which collateralsecuring the 2008 Credit Facility includes our refineries.Cash flow2010.The table below shows a summary of our audited cash flow statements as of December 31, 2008, 2009 and25
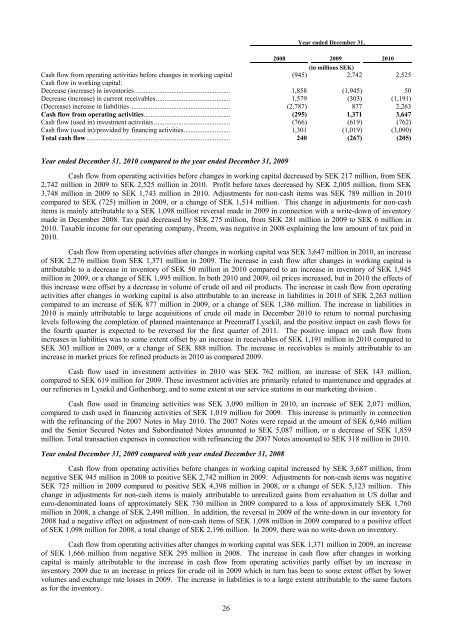
Year ended December 31,2008 2009 2010(in millions SEK)Cash flow from operating activities before changes in working capital (945) 2,742 2,525Cash flow in working capital:Decrease (increase) in inventories ....................................................... 1,858 (1,945) 50Decrease (increase) in current receivables........................................... 1,579 (303) (1,191)(Decrease) increase in liabilities .......................................................... (2,787) 877 2,263Cash flow from operating activities.................................................. (295) 1,371 3,647Cash flow (used in) investment activities ............................................ (766) (619) (762)Cash flow (used in)/provided by financing activities........................... 1,301 (1,019) (3,090)Total cash flow ................................................................................... 240 (267) (205)Year ended December 31, 2010 compared to the year ended December 31, 2009Cash flow from operating activities before changes in working capital decreased by SEK 217 million, from SEK2,742 million in 2009 to SEK 2,525 million in 2010. Profit before taxes decreased by SEK 2,005 million, from SEK3,748 million in 2009 to SEK 1,743 million in 2010. Adjustments for non-cash items was SEK 789 million in 2010compared to SEK (725) million in 2009, or a change of SEK 1,514 million. This change in adjustments for non-cashitems is mainly attributable to a SEK 1,098 million reversal made in 2009 in connection with a write-down of inventorymade in December 2008. Tax paid decreased by SEK 275 million, from SEK 281 million in 2009 to SEK 6 million in2010. Taxable income for our operating company, <strong>Preem</strong>, was negative in 2008 explaining the low amount of tax paid in2010.Cash flow from operating activities after changes in working capital was SEK 3,647 million in 2010, an increaseof SEK 2,276 million from SEK 1,371 million in 2009. The increase in cash flow after changes in working capital isattributable to a decrease in inventory of SEK 50 million in 2010 compared to an increase in inventory of SEK 1,945million in 2009, or a change of SEK 1,995 million. In both 2010 and 2009, oil prices increased, but in 2010 the effects ofthis increase were offset by a decrease in volume of crude oil and oil products. The increase in cash flow from operatingactivities after changes in working capital is also attributable to an increase in liabilities in 2010 of SEK 2,263 millioncompared to an increase of SEK 877 million in 2009, or a change of SEK 1,386 million. The increase in liabilities in2010 is mainly attributable to large acquisitions of crude oil made in December 2010 to return to normal purchasinglevels following the completion of planned maintenance at <strong>Preem</strong>raff Lysekil, and the positive impact on cash flows forthe fourth quarter is expected to be reversed for the first quarter of 2011. The positive impact on cash flow fromincreases in liabilities was to some extent offset by an increase in receivables of SEK 1,191 million in 2010 compared toSEK 303 million in 2009, or a change of SEK 888 million. The increase in receivables is mainly attributable to anincrease in market prices for refined products in 2010 as compared 2009.Cash flow used in investment activities in 2010 was SEK 762 million, an increase of SEK 143 million,compared to SEK 619 million for 2009. These investment activities are primarily related to maintenance and upgrades atour refineries in Lysekil and Gothenburg, and to some extent at our service stations in our marketing division .Cash flow used in financing activities was SEK 3,090 million in 2010, an increase of SEK 2,071 million,compared to cash used in financing activities of SEK 1,019 million for 2009. This increase is primarily in connectionwith the refinancing of the 2007 Notes in May 2010. The 2007 Notes were repaid at the amount of SEK 6,946 millionand the Senior Secured Notes and Subordinated Notes amounted to SEK 5,087 million, or a decrease of SEK 1,859million. Total transaction expenses in connection with refinancing the 2007 Notes amounted to SEK 318 million in 2010.Year ended December 31, 2009 compared with year ended December 31, 2008Cash flow from operating activities before changes in working capital increased by SEK 3,687 million, fromnegative SEK 945 million in 2008 to positive SEK 2,742 million in 2009. Adjustments for non-cash items was negativeSEK 725 million in 2009 compared to positive SEK 4,398 million in 2008, or a change of SEK 5,123 million. Thischange in adjustments for non-cash items is mainly attributable to unrealized gains from revaluation in US dollar andeuro-denominated loans of approximately SEK 730 million in 2009 compared to a loss of approximately SEK 1,760million in 2008, a change of SEK 2,490 million. In addition, the reversal in 2009 of the write-down in our inventory for2008 had a negative effect on adjustment of non-cash items of SEK 1,098 million in 2009 compared to a positive effectof SEK 1,098 million for 2008, a total change of SEK 2,196 million. In 2009, there was no write-down on inventory.Cash flow from operating activities after changes in working capital was SEK 1,371 million in 2009, an increaseof SEK 1,666 million from negative SEK 295 million in 2008. The increase in cash flow after changes in workingcapital is mainly attributable to the increase in cash flow from operating activities partly offset by an increase ininventory 2009 due to an increase in prices for crude oil in 2009 which in turn has been to some extent offset by lowervolumes and exchange rate losses in 2009. The increase in liabilities is to a large extent attributable to the same factorsas for the inventory.26
- Page 2: TABLE OF CONTENTSDisclosure Regardi
- Page 5: which was merged into Preem on Octo
- Page 8 and 9: RISK FACTORSThe risk factors below
- Page 10 and 11: the cost of exploring for, developi
- Page 12 and 13: purchase a minimum of 10% to 20% of
- Page 14 and 15: market price at the time of settlem
- Page 16 and 17: Notes, we would try to obtain waive
- Page 18 and 19: are reasonable grounds for believin
- Page 20 and 21: civil liability, whether or not pre
- Page 22 and 23: SELECTED CONSOLIDATED FINANCIAL DAT
- Page 24 and 25: MANAGEMENT’S DISCUSSION AND ANALY
- Page 26 and 27: Year ended December 31,%2008 2009 C
- Page 28 and 29: arrel in February, increased to app
- Page 30 and 31: (1) Includes sales by our supply an
- Page 34 and 35: Cash flow used in investment activi
- Page 36 and 37: Restrictions on transfers of fundsW
- Page 38 and 39: Variable rate debt—amount due .
- Page 40 and 41: As of December 31, 2008, SEK 21,999
- Page 42 and 43: Our StrengthsOur competitive streng
- Page 44 and 45: Lysekil has a total storage capacit
- Page 46 and 47: Unfinished and Blend Stocks........
- Page 48 and 49: Heating Oil .......................
- Page 50 and 51: Business-to-Business DivisionWe pre
- Page 52 and 53: “.nu,” “.org,” “.biz,”
- Page 54 and 55: Energy AB, Huda Trading AB, the Swe
- Page 56 and 57: was incorporated on March 22, 2007,
- Page 58 and 59: RELATED PARTY TRANSACTIONSCapital T
- Page 60 and 61: DESCRIPTION OF CERTAIN INDEBTEDNESS
- Page 62 and 63: effected by the Third Supplemental
- Page 64 and 65: first ranking mortgage certificates
- Page 66 and 67: LEGAL INFORMATIONCorral Petroleum H
- Page 68 and 69: CORRAL PETROLEUM HOLDINGS AB (publ)
- Page 70 and 71: CORRAL PETROLEUM HOLDINGS AB (publ)
- Page 72 and 73: CORRAL PETROLEUM HOLDINGS AB (publ)
- Page 74 and 75: CORRAL PETROLEUM HOLDINGS AB (publ)
- Page 76 and 77: SubsidiariesSubsidiaries are compan
- Page 78 and 79: The refinery installations consist
- Page 80 and 81: of occupational pension insurance,
- Page 82 and 83:
Emission rights 2010LysekilGothenbu
- Page 84 and 85:
NOTE 2. FINANCIAL RISK MANAGEMENTTh
- Page 86 and 87:
In addition to price risk managemen
- Page 88 and 89:
The fair value of borrowing is calc
- Page 90 and 91:
Reconciliation with the Group’s t
- Page 92 and 93:
The Board members including the Cha
- Page 94 and 95:
NOTE 12. EXPENSES BROKEN DOWN BY TY
- Page 96 and 97:
NOTE 16. EXCHANGE RATE DIFFERENCES
- Page 98 and 99:
Equipment, tools, fixtures and fitt
- Page 100 and 101:
NOTE 23. TRADE AND OTHER RECEIVABLE
- Page 102 and 103:
The change in the fair value of pla
- Page 104 and 105:
Loan conditions, effective interest
- Page 106 and 107:
Capitalized interest cost..........
- Page 108:
SalesDecember 31, 2009AccountsPurch