In addition to price risk management of the inventories position, the Board of Directors has defined scope forspeculative trading in oil derivatives. These transactions are limited by the definition of a ceiling for a maximum gain orloss for such trading. The Group’s loss may not be any higher than USD 10,000 per transaction and USD 50,000 perannum per individual trader. Transactions on which the Group makes a joint decision may amount to a maximum of alevel that falls within the deviation range in normal position management, and may involve a maximum loss of up toUSD 500,000 in one transaction and USD 2,500,000 per annum. These transactions must first of all always be approvedby the head of the Trading Department. The Group had as of December 31 for 2010 and 2009 respectively no position inregards to speculative trading in oil derivatives.Interest rate risk in respect of cash flows and fair valuesThe Group’s interest rate risk arises through both borrowing and lending.Loans with a variable interest rate expose the Group to an interest rate risk in respect of cash flow. Loans with afixed interest rate expose the Group to an interest rate risk in respect of fair value. The Group’s borrowing is at both fixedand variable interest rate. The interest rate risk in respect of cash flow is balanced to a light extent by borrowing at afixed rate and the use of interest rate swaps. It is the Group’s policy to have a fixed-interest period that does not exceed12 months. As of December 31, 2010 the remaining fixed-interest period totaled approx. 7.0 months. In 2010 the Group’sborrowing on variable interest rate terms consisted of SEK and USD, and fixed interest rate consisted of USD and EURfor bond loans.The Group’s interest-bearing assets are in the form of loans to associates and to a lesser extent currentinvestments in cash and cash equivalents. Loans to associates have been issued on standard market terms at a fixedinterest rate, which means that the Group is exposed to fair value risk.The Group’s outstanding borrowing as of the balance sheet date for both non-current and current loans, arrangedwith credit institutions totals SEK 14,630 million (20,227). The Group’s loan terms, effective interest rates and thematurity structure of the loans are described in note 28.If interest rates for borrowing expressed in SEK during the year had been 1.0 per cent higher/lower, with allother variables constant, the profit (loss) after tax for the fiscal year would have been SEK 49 million (143) lower/higher,mainly because of the higher/lower interest rate costs of borrowing at variable interest rates.Credit riskCredit risks arise through investments in cash and cash equivalents, derivatives and credit exposure to the largenumber of customers to which sales are made on credit. In order to limit this exposure, there are joint Group creditpolicies, which mean inter alia that only banks and financial institutions are accepted that have been given a credit ratingof at least “A” by Standard and Poor’s or by an equivalent independent assessor. As far as the Group’s customers areconcerned, a risk assessment is conducted of each customer’s creditworthiness in which the customer’s financial positionis considered, and previous experiences and other factors are assessed. Individual risk limits are defined on the basis ofinternal or external credit ratings. The Group has a credit committee that handles these matters. The Group also usessecurities in the form of, for example, Letters of Credit, bank guarantees, deposits and Parent Company mortgages. Thereis regular follow-up on the use of credit limits. The credit risk is controlled at Group level.Most of the credit exposure in terms of amounts is towards financially strong oil companies. On the basis of theGroup’s ongoing analysis of its customers, the credit quality is considered to be good. During the year the Group onlyhad provisions for doubtful receivables of SEK 16 million (22), compared with sales revenue of SEK 77,256 million(63,813).The Group has a loan issued to Corral Morocco Gas & Oil <strong>AB</strong>, which is an associate, of SEK 3,136 million. Theloan has a standard market interest rate of 5% of the nominal loan amount. The interest income is capitalized andincreases the original receivable. As of 31 December 2010, the total receivable is amounted to SEK 3,340 million. Theloan and interest fall due for payment no later than on February 6, 2013 unless otherwise agreed prior to this date. Thereis no guarantee provided towards CMGO in connection to this receivable.Counterparties during the year for derivative trading in interest rate swaps only took place with banks andfinancial institutions with a credit rating of at least “A” from Standard and Poor’s or an equivalent independent assessor.Other oil companies, banks and trading companies are counterparties for trading in oil derivatives. In order to limitcounterparty risks when trading in oil derivatives, the Company concludes so-called ISDA contracts.For further information see note 23.F-19
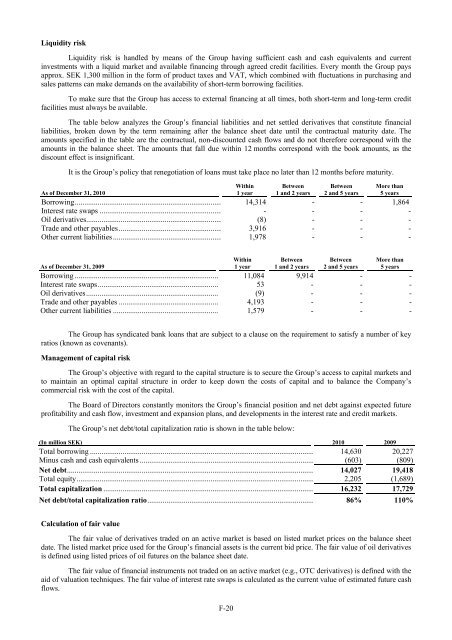
Liquidity riskLiquidity risk is handled by means of the Group having sufficient cash and cash equivalents and currentinvestments with a liquid market and available financing through agreed credit facilities. Every month the Group paysapprox. SEK 1,300 million in the form of product taxes and VAT, which combined with fluctuations in purchasing andsales patterns can make demands on the availability of short-term borrowing facilities.To make sure that the Group has access to external financing at all times, both short-term and long-term creditfacilities must always be available.The table below analyzes the Group’s financial liabilities and net settled derivatives that constitute financialliabilities, broken down by the term remaining after the balance sheet date until the contractual maturity date. Theamounts specified in the table are the contractual, non-discounted cash flows and do not therefore correspond with theamounts in the balance sheet. The amounts that fall due within 12 months correspond with the book amounts, as thediscount effect is insignificant.It is the Group’s policy that renegotiation of loans must take place no later than 12 months before maturity.As of December 31, 2010Within1 yearBetween1 and 2 yearsBetween2 and 5 yearsMore than5 yearsBorrowing............................................................................. 14,314 - - 1,864Interest rate swaps ................................................................ - - - -Oil derivatives....................................................................... (8) - - -Trade and other payables...................................................... 3,916 - - -Other current liabilities......................................................... 1,978 - - -As of December 31, 2009Within1 yearBetween1 and 2 yearsBetween2 and 5 yearsMore than5 yearsBorrowing ........................................................................... 11,084 9,914 - -Interest rate swaps............................................................... 53 - - -Oil derivatives..................................................................... (9) - - -Trade and other payables .................................................... 4,193 - - -Other current liabilities ....................................................... 1,579 - - -The Group has syndicated bank loans that are subject to a clause on the requirement to satisfy a number of keyratios (known as covenants).Management of capital riskThe Group’s objective with regard to the capital structure is to secure the Group’s access to capital markets andto maintain an optimal capital structure in order to keep down the costs of capital and to balance the Company’scommercial risk with the cost of the capital.The Board of Directors constantly monitors the Group’s financial position and net debt against expected futureprofitability and cash flow, investment and expansion plans, and developments in the interest rate and credit markets.The Group’s net debt/total capitalization ratio is shown in the table below:(In million SEK) 2010 2009Total borrowing ..................................................................................................................... 14,630 20,227Minus cash and cash equivalents ........................................................................................... (603) (809)Net debt................................................................................................................................. 14,027 19,418Total equity............................................................................................................................ 2,205 (1,689)Total capitalization .............................................................................................................. 16,232 17,729Net debt/total capitalization ratio....................................................................................... 86% 110%Calculation of fair valueThe fair value of derivatives traded on an active market is based on listed market prices on the balance sheetdate. The listed market price used for the Group’s financial assets is the current bid price. The fair value of oil derivativesis defined using listed prices of oil futures on the balance sheet date.The fair value of financial instruments not traded on an active market (e.g., OTC derivatives) is defined with theaid of valuation techniques. The fair value of interest rate swaps is calculated as the current value of estimated future cashflows.F-20
- Page 2:
TABLE OF CONTENTSDisclosure Regardi
- Page 5:
which was merged into Preem on Octo
- Page 8 and 9:
RISK FACTORSThe risk factors below
- Page 10 and 11:
the cost of exploring for, developi
- Page 12 and 13:
purchase a minimum of 10% to 20% of
- Page 14 and 15:
market price at the time of settlem
- Page 16 and 17:
Notes, we would try to obtain waive
- Page 18 and 19:
are reasonable grounds for believin
- Page 20 and 21:
civil liability, whether or not pre
- Page 22 and 23:
SELECTED CONSOLIDATED FINANCIAL DAT
- Page 24 and 25:
MANAGEMENT’S DISCUSSION AND ANALY
- Page 26 and 27:
Year ended December 31,%2008 2009 C
- Page 28 and 29:
arrel in February, increased to app
- Page 30 and 31:
(1) Includes sales by our supply an
- Page 32 and 33:
SEK 5,519 million, from a loss of S
- Page 34 and 35:
Cash flow used in investment activi
- Page 36 and 37: Restrictions on transfers of fundsW
- Page 38 and 39: Variable rate debt—amount due .
- Page 40 and 41: As of December 31, 2008, SEK 21,999
- Page 42 and 43: Our StrengthsOur competitive streng
- Page 44 and 45: Lysekil has a total storage capacit
- Page 46 and 47: Unfinished and Blend Stocks........
- Page 48 and 49: Heating Oil .......................
- Page 50 and 51: Business-to-Business DivisionWe pre
- Page 52 and 53: “.nu,” “.org,” “.biz,”
- Page 54 and 55: Energy AB, Huda Trading AB, the Swe
- Page 56 and 57: was incorporated on March 22, 2007,
- Page 58 and 59: RELATED PARTY TRANSACTIONSCapital T
- Page 60 and 61: DESCRIPTION OF CERTAIN INDEBTEDNESS
- Page 62 and 63: effected by the Third Supplemental
- Page 64 and 65: first ranking mortgage certificates
- Page 66 and 67: LEGAL INFORMATIONCorral Petroleum H
- Page 68 and 69: CORRAL PETROLEUM HOLDINGS AB (publ)
- Page 70 and 71: CORRAL PETROLEUM HOLDINGS AB (publ)
- Page 72 and 73: CORRAL PETROLEUM HOLDINGS AB (publ)
- Page 74 and 75: CORRAL PETROLEUM HOLDINGS AB (publ)
- Page 76 and 77: SubsidiariesSubsidiaries are compan
- Page 78 and 79: The refinery installations consist
- Page 80 and 81: of occupational pension insurance,
- Page 82 and 83: Emission rights 2010LysekilGothenbu
- Page 84 and 85: NOTE 2. FINANCIAL RISK MANAGEMENTTh
- Page 88 and 89: The fair value of borrowing is calc
- Page 90 and 91: Reconciliation with the Group’s t
- Page 92 and 93: The Board members including the Cha
- Page 94 and 95: NOTE 12. EXPENSES BROKEN DOWN BY TY
- Page 96 and 97: NOTE 16. EXCHANGE RATE DIFFERENCES
- Page 98 and 99: Equipment, tools, fixtures and fitt
- Page 100 and 101: NOTE 23. TRADE AND OTHER RECEIVABLE
- Page 102 and 103: The change in the fair value of pla
- Page 104 and 105: Loan conditions, effective interest
- Page 106 and 107: Capitalized interest cost..........
- Page 108: SalesDecember 31, 2009AccountsPurch