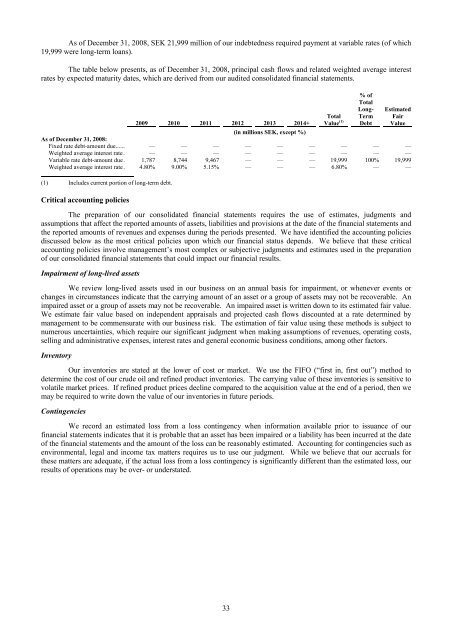
As of December 31, 2008, SEK 21,999 million of our indebtedness required payment at variable rates (of which19,999 were long-term loans).The table below presents, as of December 31, 2008, principal cash flows and related weighted average interestrates by expected maturity dates, which are derived from our audited consolidated financial statements.TotalValue (1)% ofTotalLong-TermDebtEstimatedFairValue2009 2010 2011 2012 2013 2014+(in millions SEK, except %)As of December 31, 2008:Fixed rate debt-amount due...... — — — — — — — — —Weighted average interest rate. — — — — — — — — —Variable rate debt-amount due. 1,787 8,744 9,467 — — — 19,999 100% 19,999Weighted average interest rate. 4.80% 9.00% 5.15% — — — 6.80% — —(1) Includes current portion of long-term debt.Critical accounting policiesThe preparation of our consolidated financial statements requires the use of estimates, judgments andassumptions that affect the reported amounts of assets, liabilities and provisions at the date of the financial statements andthe reported amounts of revenues and expenses during the periods presented. We have identified the accounting policiesdiscussed below as the most critical policies upon which our financial status depends. We believe that these criticalaccounting policies involve management’s most complex or subjective judgments and estimates used in the preparationof our consolidated financial statements that could impact our financial results.Impairment of long-lived assetsWe review long-lived assets used in our business on an annual basis for impairment, or whenever events orchanges in circumstances indicate that the carrying amount of an asset or a group of assets may not be recoverable. Animpaired asset or a group of assets may not be recoverable. An impaired asset is written down to its estimated fair value.We estimate fair value based on independent appraisals and projected cash flows discounted at a rate determined bymanagement to be commensurate with our business risk. The estimation of fair value using these methods is subject tonumerous uncertainties, which require our significant judgment when making assumptions of revenues, operating costs,selling and administrative expenses, interest rates and general economic business conditions, among other factors.InventoryOur inventories are stated at the lower of cost or market. We use the FIFO (“first in, first out”) method todetermine the cost of our crude oil and refined product inventories. The carrying value of these inventories is sensitive tovolatile market prices. If refined product prices decline compared to the acquisition value at the end of a period, then wemay be required to write down the value of our inventories in future periods.ContingenciesWe record an estimated loss from a loss contingency when information available prior to issuance of ourfinancial statements indicates that it is probable that an asset has been impaired or a liability has been incurred at the dateof the financial statements and the amount of the loss can be reasonably estimated. Accounting for contingencies such asenvironmental, legal and income tax matters requires us to use our judgment. While we believe that our accruals forthese matters are adequate, if the actual loss from a loss contingency is significantly different than the estimated loss, ourresults of operations may be over- or understated.33
BUSINESSOverviewWe are the largest oil refining company in the Nordic region in terms of capacity. We conduct our businessthrough our wholly owned operating company, <strong>Preem</strong>, which operates its business through two segments, a supply andrefining segment and a marketing segment. We refine crude oil in Sweden and then market and sell refined productsprimarily in Sweden and other northwestern European markets, including Scandinavia, France, Germany and the UnitedKingdom, as well as the United States and, to a lesser extent, other markets. Our refineries represented approximately80% of the refining capacity in Sweden and approximately 30% of the refining capacity in the Nordic region in 2010.We sell more refined products in Sweden than any of our competitors. In Sweden, we had the leading market share in2010 in terms of sales volume of diesel, heating oil and fuel oil with approximately 35% of diesel sales, 49% of heatingoil sales and 52% of fuel oil sales, according to the Swedish Statistical Central Bureau. In addition, our marketingsegment’s share of the Swedish retail gasoline and diesel markets in terms of sales volume were approximately 12% and25%, respectively, in 2010, based on data from the Swedish Statistical Central Bureau.Our supply and refining segment purchases and refines crude oil and then sells refined products wholesale to ourmarketing segment and to third parties. We also own a strategically located network of storage depots in Sweden. In2010, our supply and refining segment sold approximately 80% (by value) of its products to third parties and 20% (byvalue) to our marketing segment as compared to 81% (by value) and 19% (by value), respectively, in 2009. Our supplyand refining segment had sales revenue of SEK 76,050 million (€8,448 million), SEK 61,870 million (€6,873 million)and SEK 85,336 million (€9,480 million) and operating income of SEK 2,693 million (€299 million), operating incomeof SEK 4,847 million (€538 million) and operating loss of SEK 672 million (€75 million) for the years ended December31, 2010, 2009 and 2008, respectively. Our marketing segment consists of two divisions: a business-to-business divisionand a station and consumer division. The marketing segment resells refined products, wholesale, primarily in Sweden.We also sell our gasoline and diesel through approximately 390 <strong>Preem</strong>-branded manned and unmanned service stations,which are company-owned and dealer-operated, along with approximately 180 company-owned Såifa-branded dieseltruck stops. Our marketing segment had sales revenue of SEK 16,822 million (€1,869 million), SEK 13,702 million(€1,522 million) and SEK 16,140 million (€1,793 million) and operating income of SEK 349 million (€39 million),operating income of SEK 213 million (€24 million) and operating loss of SEK 6 million (€1 million) for the years endedDecember 31, 2010, 2009 and 2008, respectively.The following table shows the sales revenue and operating profit/(loss) for the business segments of <strong>Preem</strong>, ouroperating subsidiary, for each of the years ended December 31, 2008, 2009 and 2010.Year endedDecember 31,2008Year endedDecember 31,2009Year endedDecember 31,2010SEK € (1) SEK € (1) SEK € (1)(in millions)Sales Revenue:Supply and refining (2) ............................................................... 85,336 9,480 61,870 6,873 76,050 8,448Marketing ................................................................................. 16,140 1,793 13,702 1,522 16,822 1,869Exchange rate differences ........................................................ 482 54 (21) (2) (83) (9)Group eliminations................................................................... (14,583) (1,620) (11,738) (1,304) (15,533) (1,726)Total Sales Revenue (3) ....................................................... 87,375 9,706 63,813 7,089 77,256 8,582Operating profit/(loss):Supply and refining .................................................................. (672) (75) 4,847 538 2,693 299Marketing ................................................................................. (6) (1) 213 24 349 39Other non-allocated income (expense) (4) ................................. (362) (40) (801) (89) (771) (86)Total operating profit/(loss) ............................................. (1,040) (116) 4,259 473 2,271 252(1) We have translated kronor into euro at the rate of €1.00=SEK 9.002 (the exchange rate on December 31, 2010). We have provided thistranslation solely for your convenience.(2) Includes sales by our supply and refining segment to our marketing segment of SEK 14,485 million (€1,609 million) for 2008, SEK 11,659million (€1,295 million) for 2009 and SEK 15,450 million (€1,716 million) for 2010. These sales are made at market rates. Since refinedproducts are commodities, these sales could have been made to third parties at similar prices. We believe that including these amounts insupply and refining segment sales revenue properly reflects the results of these segments for purposes of comparison. Such inter-companysales are eliminated in our audited annual consolidated financial statements.(3) Total sales revenue is our net sales less excise duties, which are taxes collected at the point of sale by us and remitted to the governments ofthe countries in which we operate, primarily Sweden.(4) In order to evaluate the performance of our segments, we allocate certain items as “non-allocated income (expense).” Specifically, weinclude in non-allocated income (expense) our “corporate cost center” and foreign exchange gains or losses related to our inventory and ouraccounts payable/receivable. Our corporate cost center includes administrative and personnel-related expenses.34
- Page 2: TABLE OF CONTENTSDisclosure Regardi
- Page 5: which was merged into Preem on Octo
- Page 8 and 9: RISK FACTORSThe risk factors below
- Page 10 and 11: the cost of exploring for, developi
- Page 12 and 13: purchase a minimum of 10% to 20% of
- Page 14 and 15: market price at the time of settlem
- Page 16 and 17: Notes, we would try to obtain waive
- Page 18 and 19: are reasonable grounds for believin
- Page 20 and 21: civil liability, whether or not pre
- Page 22 and 23: SELECTED CONSOLIDATED FINANCIAL DAT
- Page 24 and 25: MANAGEMENT’S DISCUSSION AND ANALY
- Page 26 and 27: Year ended December 31,%2008 2009 C
- Page 28 and 29: arrel in February, increased to app
- Page 30 and 31: (1) Includes sales by our supply an
- Page 32 and 33: SEK 5,519 million, from a loss of S
- Page 34 and 35: Cash flow used in investment activi
- Page 36 and 37: Restrictions on transfers of fundsW
- Page 38 and 39: Variable rate debt—amount due .
- Page 42 and 43: Our StrengthsOur competitive streng
- Page 44 and 45: Lysekil has a total storage capacit
- Page 46 and 47: Unfinished and Blend Stocks........
- Page 48 and 49: Heating Oil .......................
- Page 50 and 51: Business-to-Business DivisionWe pre
- Page 52 and 53: “.nu,” “.org,” “.biz,”
- Page 54 and 55: Energy AB, Huda Trading AB, the Swe
- Page 56 and 57: was incorporated on March 22, 2007,
- Page 58 and 59: RELATED PARTY TRANSACTIONSCapital T
- Page 60 and 61: DESCRIPTION OF CERTAIN INDEBTEDNESS
- Page 62 and 63: effected by the Third Supplemental
- Page 64 and 65: first ranking mortgage certificates
- Page 66 and 67: LEGAL INFORMATIONCorral Petroleum H
- Page 68 and 69: CORRAL PETROLEUM HOLDINGS AB (publ)
- Page 70 and 71: CORRAL PETROLEUM HOLDINGS AB (publ)
- Page 72 and 73: CORRAL PETROLEUM HOLDINGS AB (publ)
- Page 74 and 75: CORRAL PETROLEUM HOLDINGS AB (publ)
- Page 76 and 77: SubsidiariesSubsidiaries are compan
- Page 78 and 79: The refinery installations consist
- Page 80 and 81: of occupational pension insurance,
- Page 82 and 83: Emission rights 2010LysekilGothenbu
- Page 84 and 85: NOTE 2. FINANCIAL RISK MANAGEMENTTh
- Page 86 and 87: In addition to price risk managemen
- Page 88 and 89: The fair value of borrowing is calc
- Page 90 and 91:
Reconciliation with the Group’s t
- Page 92 and 93:
The Board members including the Cha
- Page 94 and 95:
NOTE 12. EXPENSES BROKEN DOWN BY TY
- Page 96 and 97:
NOTE 16. EXCHANGE RATE DIFFERENCES
- Page 98 and 99:
Equipment, tools, fixtures and fitt
- Page 100 and 101:
NOTE 23. TRADE AND OTHER RECEIVABLE
- Page 102 and 103:
The change in the fair value of pla
- Page 104 and 105:
Loan conditions, effective interest
- Page 106 and 107:
Capitalized interest cost..........
- Page 108:
SalesDecember 31, 2009AccountsPurch