- Page 2:
Fishery and Sea Resources
- Page 5 and 6:
Fishery and Sea Resourcesto nest in
- Page 7 and 8:
Fishery and Sea ResourcesFigure 2:
- Page 9 and 10:
Fishery and Sea ResourcesFigure 3:
- Page 11 and 12:
Fishery and Sea Resourcesturtles. S
- Page 13 and 14:
Fishery and Sea Resourcesshould be
- Page 15 and 16:
Fishery and Sea ResourcesTable 1: A
- Page 17 and 18:
Fishery and Sea ResourcesReferences
- Page 19 and 20:
Fishery and Sea Resources[25] M. Na
- Page 21 and 22:
Fishery and Sea Resources1856
- Page 23 and 24:
Fishery and Sea Resourcesbatus) or
- Page 25 and 26:
Fishery and Sea ResourcesTable 1: D
- Page 27 and 28:
Fishery and Sea ResourcesFigure 2:
- Page 29 and 30:
Fishery and Sea ResourcesFigure 4:
- Page 31 and 32:
Fishery and Sea ResourcesFigure 6:
- Page 33 and 34:
Fishery and Sea ResourcesFigure 8:
- Page 35 and 36:
Fishery and Sea ResourcesFigure 10:
- Page 37 and 38:
Fishery and Sea ResourcesReferences
- Page 39 and 40:
Fishery and Sea Resources1874
- Page 41 and 42:
Fishery and Sea Resourcesand at low
- Page 43 and 44:
Fishery and Sea ResourcesFigure 2:
- Page 45 and 46:
Fishery and Sea ResourcesFigure 4:
- Page 47 and 48:
Fishery and Sea Resourcesj a C D C
- Page 49 and 50:
Fishery and Sea ResourcesDoorARjHFa
- Page 51 and 52:
Fishery and Sea Resourcesbeen reach
- Page 53 and 54:
Fishery and Sea Resources1888
- Page 55 and 56:
Fishery and Sea Resourcestigated th
- Page 57 and 58:
Fishery and Sea ResourcesFigure 2:
- Page 59 and 60:
Fishery and Sea Resourcesmerge dail
- Page 61 and 62:
Fishery and Sea Resources1896
- Page 63 and 64:
Fishery and Sea Resourcesnetic hete
- Page 65 and 66:
Fishery and Sea ResourcesFigure 1:
- Page 67 and 68:
Fishery and Sea ResourcesFigure 3:
- Page 69 and 70:
Fishery and Sea ResourcesReferences
- Page 71 and 72:
Fishery and Sea Resources[23] B. Gr
- Page 73 and 74:
Fishery and Sea Resourcescreases, r
- Page 75 and 76:
Fishery and Sea Resourcestails see
- Page 77 and 78:
Fishery and Sea Resourceshave grown
- Page 79 and 80:
Fishery and Sea Resourcesfraction o
- Page 81 and 82:
Fishery and Sea Resources1916Figure
- Page 83 and 84:
Fishery and Sea ResourcesFigure 4:
- Page 85 and 86:
Fishery and Sea ResourcesReferences
- Page 87 and 88:
Fishery and Sea Resources1922
- Page 89 and 90:
Fishery and Sea ResourcesFigure 1:
- Page 91 and 92:
Fishery and Sea Resourcesbeen calcu
- Page 93 and 94:
Fishery and Sea ResourcesFigure 4:
- Page 95 and 96:
Fishery and Sea ResourcesFigure 6:
- Page 97 and 98:
Fishery and Sea Resourceswhile on t
- Page 99 and 100:
lance the chance of damaging the ge
- Page 101 and 102:
Fishery and Sea Resources[14] R.R.
- Page 103 and 104:
Fishery and Sea Resources[42] T.J.
- Page 105 and 106:
Fishery and Sea Resources1940
- Page 107 and 108:
Fishery and Sea Resourcesing fish,
- Page 109 and 110:
Fishery and Sea Resources10 sea bas
- Page 111 and 112:
Fishery and Sea Resourcesstagechara
- Page 113 and 114:
Fishery and Sea ResourcesTRAS (in s
- Page 115 and 116:
Fishery and Sea Resources4 Discussi
- Page 117 and 118:
Fishery and Sea ResourcesReferences
- Page 119 and 120:
Fishery and Sea Resources[25] P. Go
- Page 121 and 122:
Fishery and Sea Resources1956
- Page 123 and 124:
Fishery and Sea Resourcesability, i
- Page 125 and 126:
Fishery and Sea ResourcesFigure 2:
- Page 127 and 128:
Fishery and Sea Resources6. Sale. T
- Page 129 and 130:
Fishery and Sea Resourcesexperiment
- Page 131 and 132:
Fishery and Sea Resources[20] R. Hi
- Page 133 and 134:
Fishery and Sea ResourcesFigure 1:
- Page 135 and 136:
Fishery and Sea Resourcestranscript
- Page 137 and 138:
Fishery and Sea ResourcesFigure 2:
- Page 139 and 140:
Fishery and Sea Resourcesquantifica
- Page 141 and 142:
Fishery and Sea Resourcestion of th
- Page 143 and 144:
Fishery and Sea Resources[22] A. Ha
- Page 145 and 146:
Fishery and Sea ResourcesFigure 1:
- Page 147 and 148:
Fishery and Sea Resourcesting the y
- Page 149 and 150:
Fishery and Sea ResourcesSpecies Su
- Page 151 and 152:
Fishery and Sea Resources6 Acknowle
- Page 153 and 154:
Fishery and Sea Resources[22] G. Ga
- Page 155 and 156:
Fishery and Sea ResourcesFigure 1:
- Page 157 and 158:
Fishery and Sea ResourcesParameters
- Page 159 and 160:
BI (Kg per km 2 )Fishery and Sea Re
- Page 161 and 162:
Y/R (g)SSB/R (g)Fishery and Sea Res
- Page 163 and 164:
BI (Kg per km2)20092008200720062005
- Page 165 and 166:
Fishing mortality (2-4)Fishing mort
- Page 167 and 168:
Number of runsFishing mortality (F)
- Page 169 and 170:
Fishery and Sea ResourcesStock stat
- Page 171 and 172:
Fishery and Sea Resources[14] C.L.
- Page 173 and 174:
Fishery and Sea Resourcesare object
- Page 175 and 176:
Fishery and Sea Resourcesan electro
- Page 177 and 178:
Fishery and Sea Resourceshabt*ccced
- Page 179 and 180:
Fishery and Sea Resourcespcdcofmdcb
- Page 181 and 182:
Fishery and Sea ResourcesReferences
- Page 183 and 184:
Fishery and Sea Resources2018
- Page 185 and 186:
Fishery and Sea ResourcesMid-Line20
- Page 187 and 188:
Fishery and Sea ResourcesLow biomas
- Page 189 and 190:
Fishery and Sea Resourcesthen, afte
- Page 191 and 192:
################################ ##
- Page 193 and 194:
Fishery and Sea ResourcesReferences
- Page 195 and 196:
Fishery and Sea Resources2030
- Page 197 and 198:
Fishery and Sea ResourcesNeverthele
- Page 199 and 200:
Fishery and Sea Resources2.3.2 Data
- Page 201 and 202:
Fishery and Sea Resources& Aguado G
- Page 203 and 204:
Fishery and Sea ResourcesReferences
- Page 205 and 206:
Fishery and Sea Resources[27] F. Bi
- Page 207 and 208:
Fishery and Sea Resources2042
- Page 209 and 210:
Fishery and Sea ResourcesFigure 1:
- Page 211 and 212:
Fishery and Sea ResourcesFigure 3:
- Page 213 and 214:
Fishery and Sea Resourcesthe polych
- Page 215 and 216:
Fishery and Sea Resources4 Discussi
- Page 217 and 218:
Fishery and Sea ResourcesReferences
- Page 219 and 220:
Fishery and Sea Resources[28] A.P.
- Page 221 and 222:
Fishery and Sea ResourcesFigure 1:
- Page 223 and 224:
Fishery and Sea ResourcesFigure 3:
- Page 225 and 226:
Fishery and Sea Resources2.3 Otolit
- Page 227 and 228:
Fishery and Sea ResourcesFigure 5:
- Page 229 and 230:
Fishery and Sea ResourcesFigure 7:
- Page 231 and 232:
Fishery and Sea Resourceshigher tem
- Page 233 and 234:
Fishery and Sea Resources[12] S. Kh
- Page 235 and 236:
Fishery and Sea Resources[37] G.E.
- Page 237 and 238:
Fishery and Sea Resourcespolicy dec
- Page 239 and 240:
Fishery and Sea ResourcesFigure 1:
- Page 241 and 242:
Fishery and Sea ResourcesFigure 3:
- Page 243 and 244:
Fishery and Sea Resources5 Analysis
- Page 245 and 246:
Fishery and Sea Resources[2] G. Rel
- Page 247 and 248:
Fishery and Sea Resources[27] G.R.
- Page 249 and 250:
Fishery and Sea Resourcesthe organi
- Page 251 and 252:
Fishery and Sea ResourcesFigure 2:
- Page 253 and 254:
Fishery and Sea ResourcesFigure 4:
- Page 255 and 256:
Fishery and Sea ResourcesFigure 6:
- Page 257 and 258:
Fishery and Sea ResourcesFigure 8:
- Page 259 and 260:
Fishery and Sea ResourcesReferences
- Page 261 and 262:
Fishery and Sea Resources[26] M.G.
- Page 263 and 264:
Fishery and Sea Resources2098
- Page 265 and 266:
Fishery and Sea Resourcesgrowth [14
- Page 267 and 268:
Fishery and Sea Resources(YOY) fish
- Page 269 and 270:
Fishery and Sea Resources6000500040
- Page 271 and 272:
Fishery and Sea Resources3025Sparus
- Page 273 and 274:
Fishery and Sea Resourcesfirst in O
- Page 275 and 276:
Fishery and Sea ResourcesAnguilla a
- Page 277 and 278:
Fishery and Sea ResourcesReferences
- Page 279 and 280:
Fishery and Sea Resources[27] R. Ro
- Page 281 and 282: Fishery and Sea Resourcesspecies mo
- Page 283 and 284: Fishery and Sea ResourcesFigure 2:
- Page 285 and 286: Fishery and Sea ResourcesYear S1 S2
- Page 287 and 288: Fishery and Sea ResourcesFigure 6:
- Page 289 and 290: Fishery and Sea Resources2124
- Page 291 and 292: Fishery and Sea ResourcesFigure 1:
- Page 293 and 294: Fishery and Sea ResourcesFigure 4:
- Page 295 and 296: Fishery and Sea ResourcesFigure 6:
- Page 297 and 298: Fishery and Sea ResourcesFigure 8:
- Page 299 and 300: Fishery and Sea ResourcesFigure 10:
- Page 301 and 302: Fishery and Sea ResourcesFigure 13:
- Page 303 and 304: Fishery and Sea ResourcesFigure 17:
- Page 305 and 306: Fishery and Sea ResourcesFigure 21:
- Page 307 and 308: Fishery and Sea ResourcesFigure 25:
- Page 309 and 310: Fishery and Sea ResourcesFigure 29:
- Page 311 and 312: Fishery and Sea ResourcesReferences
- Page 313 and 314: Fishery and Sea Resources2148
- Page 315 and 316: Fishery and Sea Resourcesthe weight
- Page 317 and 318: Fishery and Sea ResourcesFigure 2:
- Page 319 and 320: Fishery and Sea ResourcesFigure 4:
- Page 321 and 322: Fishery and Sea ResourcesFigure 6:
- Page 323 and 324: Fishery and Sea ResourcesReferences
- Page 325 and 326: Fishery and Sea Resources[26] A. M
- Page 327 and 328: Fishery and Sea Resources2162
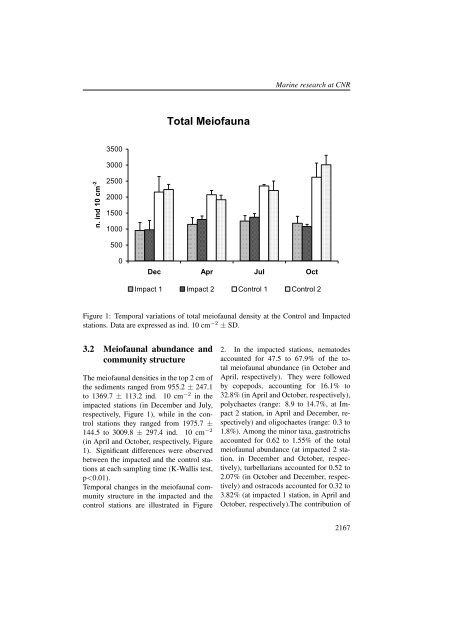
- Page 329 and 330: Fishery and Sea Resourcesimmediatel
- Page 331: Fishery and Sea ResourcesPRT(g g -1
- Page 335 and 336: Ne/KyFishery and Sea ResourcesNemat
- Page 337 and 338: Fishery and Sea Resources[4] M. Hol
- Page 339 and 340: Fishery and Sea Resources[28] T. La
- Page 341 and 342: Fishery and Sea Resourcesmunity can
- Page 343 and 344: Fishery and Sea Resources3 The fish
- Page 345 and 346: Fishery and Sea Resourcesthe fisher
- Page 347 and 348: Fishery and Sea Resources[16] J.M.
- Page 349: Fishery and Sea Resources2184