thèse doctorat de l'université bordeaux 2 - ISPED-Enseignement à ...
thèse doctorat de l'université bordeaux 2 - ISPED-Enseignement à ...
thèse doctorat de l'université bordeaux 2 - ISPED-Enseignement à ...

Create successful ePaper yourself
Turn your PDF publications into a flip-book with our unique Google optimized e-Paper software.
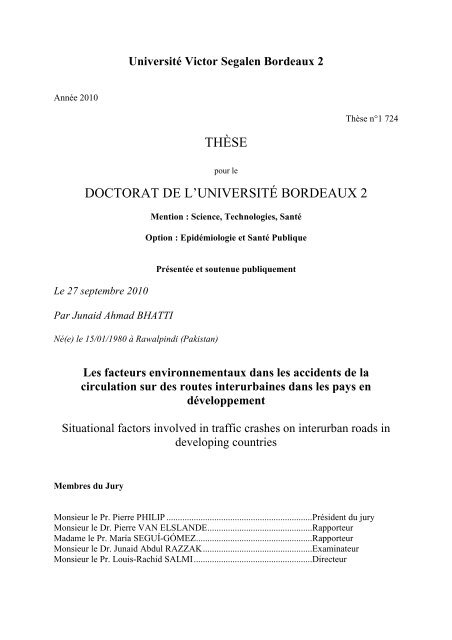
Université Victor Segalen Bor<strong>de</strong>aux 2Année 2010Thèse n°1 724THÈSEpour leDOCTORAT DE L’UNIVERSITÉ BORDEAUX 2Mention : Science, Technologies, SantéOption : Epidémiologie et Santé PubliqueLe 27 septembre 2010Par Junaid Ahmad BHATTINé(e) le 15/01/1980 <strong>à</strong> Rawalpindi (Pakistan)Présentée et soutenue publiquementLes facteurs environnementaux dans les acci<strong>de</strong>nts <strong>de</strong> lacirculation sur <strong>de</strong>s routes interurbaines dans les pays endéveloppementSituational factors involved in traffic crashes on interurban roads in<strong>de</strong>veloping countriesMembres du JuryMonsieur le Pr. Pierre PHILIP ................................................................Prési<strong>de</strong>nt du juryMonsieur le Dr. Pierre VAN ELSLANDE..............................................RapporteurMadame le Pr. María SEGUÍ-GÓMEZ...................................................RapporteurMonsieur le Dr. Junaid Abdul RAZZAK................................................ExaminateurMonsieur le Pr. Louis-Rachid SALMI....................................................Directeur
ContentsAbbreviations ............................................................................................................................. 8Résumé ....................................................................................................................................... 9Abstract .................................................................................................................................... 101. Introduction .......................................................................................................................... 111. Introduction .......................................................................................................................... 132. Background .......................................................................................................................... 142.1 Road injury bur<strong>de</strong>n in LMICs ........................................................................................ 142.2 Road safety is a key to <strong>de</strong>velopment in LMICs ............................................................. 142.3 Risk factors..................................................................................................................... 152.4 Multiple factors involved in traffic crashes.................................................................... 162.5 Implications of interactions for highway safety............................................................. 162.6 Factors limiting implementation of engineering measures in LMICs............................ 172.7 Interurban road safety research gaps in LMICs ............................................................. 203. Objectives............................................................................................................................. 204. Descriptive studies ............................................................................................................... 214.1 Study I: Traffic crash and injury bur<strong>de</strong>n on Yaoundé-Douala road section, Cameroon 21Objectives......................................................................................................................... 22Methods............................................................................................................................ 22Results .............................................................................................................................. 244.2 Study II: Differences in police, ambulance, and emergency <strong>de</strong>partment reporting oftraffic injuries on Karachi-Hala road section, Pakistan........................................................ 29Objectives......................................................................................................................... 29Methods............................................................................................................................ 30Results .............................................................................................................................. 315. Analytical Studies ................................................................................................................ 365.1 Study III: Situational factors at traffic crash sites: a case-control study on Yaoundé-Douala road section, Cameroon ........................................................................................... 36Objectives......................................................................................................................... 37Methods............................................................................................................................ 37Results .............................................................................................................................. 385.2 Study IV: Bur<strong>de</strong>n and factors associated with highway work zone crashes, Karachi-Hala road section, Pakistan .................................................................................................. 41Objectives......................................................................................................................... 41Methods............................................................................................................................ 42Results .............................................................................................................................. 445.3 Study V: Road hazard perception at high-risk crash sites in voluntary Pakistani drivers.............................................................................................................................................. 47Objectives......................................................................................................................... 47Methods............................................................................................................................ 48Results .............................................................................................................................. 516. Discussion ............................................................................................................................ 566.1 Originality of studies...................................................................................................... 566.2 Comparison with published literature ............................................................................ 567. Limitations and perspectives................................................................................................ 618. Conclusion............................................................................................................................ 62References ................................................................................................................................ 633
Publications (peer-reviewed).................................................................................................... 71Related to thesis ................................................................................................................... 71Other articles related to traffic injuries................................................................................. 71Related to other injuries ....................................................................................................... 72Appendices ............................................................................................................................... 734
In<strong>de</strong>x of tablesTable 1. The Haddon Matrix applied to highway crashes involving speed (examples ofintervention) ............................................................................................................................. 15Table 2. Traffic fatalities according to road network type in France, 2004............................. 17Table 3 Bur<strong>de</strong>n of road traffic crashes and injuries, according to vehicle type on Yaoundé-Douala road section (2004-2007)............................................................................................. 24Table 4. Crash types, causes, and situational factors on the Yaoundé-Douala road section(2004-2007).............................................................................................................................. 27Table 5. Traffic injury outcome, according to road-user characteristics, on the Yaoundé-Douala road section (2004-2007)............................................................................................. 28Table 6. Traffic injuries reported to police, ambulance, and emergency <strong>de</strong>partment onKarachi-Hala road section (2008). ........................................................................................... 34Table 7. Differences in outcome of traffic injury among police, ambulance, and emergency<strong>de</strong>partment for same patient on Karachi-Hala road section, 2008 (N=108) ............................ 35Table 8. Ascertainment of police, ambulance, and emergency <strong>de</strong>partment records for trafficfatalities and injuries on Karachi-Hala road section (N=1 214)............................................... 35Table 9. Situational variables at case and control sites on Yaoundé-Douala road section,Cameroon ................................................................................................................................. 40Table 10. Road crash fatality and injury risk per 10 9 vehicle-km on the Karachi-Hala roadsection, Pakistan (2006-08) ...................................................................................................... 45Table 11. Highway work zone crash fatality and injury risk per 10 9 vehicle-km on 50-km longsub-section on Karachi-Hala road, Pakistan (2006-08) ........................................................... 45Table 12. Factors associated with work-zone crashes on the 196-km-long Karachi-Hala roadsection, Pakistan (2006-08) ...................................................................................................... 46Table 13. Characteristics of high- and low-risk sites on Yaoundé-Douala and Karachi-Halaroad sections............................................................................................................................. 52Table 14. Characteristics of Pakistani drivers inclu<strong>de</strong>d in sample (N=100)............................ 53Table 15. Differences in hazard perception, and reported preferred speeds for high- and lowrisksite pairs on Yaoundé-Douala and Karachi-Hala road sections........................................ 54Table 16. Factors associated with hazard perception of high- and low-risk sites on Yaoundé-Douala and Karachi-Hala road sections ................................................................................... 55Table 17. Analytical studies of traffic crash and injury risk on interurban road sections in<strong>de</strong>veloping countries. ............................................................................................................... 79Table 18. Traffic injury intervention studies on interurban road sections in <strong>de</strong>velopingcountries. .................................................................................................................................. 80Table 19. Traffic fatalities and injuries according to crash types and causes on Yaoundé-Douala road section (2004-3007)............................................................................................. 87Table 20. Driver age, sex, and vehicles driven on Karachi-Hala road section (July 2009) ... 137Table 21. Situational factors at high- and low- risk site pairs on Yaoundé-Douala and Karachi-Hala road sections .................................................................................................................. 138Table 22. Driver-related factors associated with hazard perception of sites on Yaoundé-Douala and Karachi-Hala road sections ................................................................................. 139Table 23. Situational factors associated with hazard perception of sites on Yaoundé-Doualaand Karachi-Hala road sections.............................................................................................. 1405
In<strong>de</strong>x of figuresFigure 1. Traffic fatality per 100 000 inhabitants in various countries [2] .............................. 14Figure 2. Traffic fatalities according to road user groups in different countries...................... 15Figure 3. Contribution of risk factors in road traffic crashes (adapted from [55]) .................. 16Figure 4. Percentage difference of crash fatalities between official reported and estimatedfigures (adapted from WHO, 2009 [2]).................................................................................... 18Figure 5. Causes of road crashes as <strong>de</strong>termined by the police in <strong>de</strong>veloping countries (adaptedfrom Wootton and Jacobs 1996 [7])......................................................................................... 19Figure 6. Traffic injury outcome, according to road user group on Yaoundé-Douala roadsection (2004-2007).................................................................................................................. 25Figure 7. Monthly trend of traffic fatalities and injuries on the Yaoundé-Douala road section(Jan 2004 to May 2007) ........................................................................................................... 26Figure 8. Month-wise police, ambulance, and emergency <strong>de</strong>partment reporting of trafficinjuries on Karachi-Hala road section (2008). ......................................................................... 32Figure 9. Outcome of traffic injuries reported to emergency <strong>de</strong>partment according to NewInjury Severity Score (NISS) on Karachi-Hala road section (2008)........................................ 33Figure 10. Traffic injuries reported to police, ambulance service, and emergency <strong>de</strong>partmentson Karachi-Hala road section in 2008 (N=1 214) .................................................................... 35Figure 11. Injury crash site <strong>de</strong>nsity along 25-km stretches of Yaoundé-Douala road section. 39Figure 12. Karachi-Hala Road Section, province of Sindh, Pakistan ...................................... 42Figure 13. Examples of normal traffic zone (A) and work zone (B) on interurban road sectionin the province of Sindh, Pakistan............................................................................................ 43Figure 14. Picture extracted of a high-risk site vi<strong>de</strong>o and related questions, from the Karachi-Hala road section...................................................................................................................... 50Figure 15. Literature available for assessing research needs on interurban traffic safety (1995-2009)......................................................................................................................................... 75Figure 16. Weekly pattern of traffic fatalities and injuries on Yaoundé-Douala road section(2004-2007).............................................................................................................................. 86Figure 17. Hourly pattern of traffic crashes and fatalities on Yaoundé-Douala road section(2004-2007).............................................................................................................................. 866
AcknowledgementsI am thankful to Allah for the courage he has bestowed upon me; to my parents for being rolemo<strong>de</strong>ls; to my wife for her unconditional love and affection; to my daughter for giving mylife a sense; to my teachers; and friends for their support to complete this workThis thesis was not possible without the guidance and attention that I had received from mysupervisor, Pr. L. Rachid SALMI. His keen interest and patience throughout my training inMasters and then in PhD were invaluable contribution to this whole work.I am grateful to Dr. Emmanuel LAGARDE, who had played a very vital role in this thesis andhelped us advance this work when it was not that evi<strong>de</strong>nt.I express my gratitu<strong>de</strong> to Dr. Junaid A. RAZZAK, his encouragement in the field helped meendure the difficult work conditions and to come up with useful questions and data for thisthesis.In France, I would like to thank all the members of the research team PPCT, in particularAymery CONSTANT, Benjamin CONTRAND, and Ludivine ORRIOLS. At <strong>ISPED</strong>, I amgrateful to all the teachers and in particular to Mme. Marthe-Aline JUTAND and Pr.Ahmadou ALIOUM for their guidance. Special thanks to Dr. Jean-François TESSIER for allthe support he has given during our stay in France. I am also grateful to my colleagues in theMaster’s program, in particular Mohammad BERRAHO (Morocco) for helping me with mystudies. I am also thankful to Mr. Zaheer SATTI (Paris) to help us during stay at differentoccasions.In Pakistan, I would like to thank Dr. Aftab PATHAN (NHMP), Mr. Irshad SODHAR(NHMP), Mr. Naeem-ul-lah SHIEKH (NHMP), Eng. Ali Bin Usman SHAH (NHA), Mr.Ameer HUSSAIN (RTIRP, JPMC), Mr. Faisal EDHI (Edhi foundation), Mr. Javed SHAH(AKU), Dr. Sanaullah BASHIR (DUHS), and Dr. Kiran EJAZ (AKU) for their support in datacollection. Special thanks to my Uncle and Aunt in Karachi for helping me during my stay.I would like to acknowledge Dr. Jöelle SOBNGWI and other co-investigators, for theirsupport in completing road safety studies in Cameroon.This thesis was completed with the financial support of the Higher Education Commission ofPakistan. I am also grateful to Pr. Georges PIERRON (SFERE) and Mme FranceLAMISCARRE at SFERE (Paris) for their support during my studies.I would like to thank all the drivers who participated in the hazard perception study and theowners of transport agencies who provi<strong>de</strong>d us the space to conduct the interviews.7
AbbreviationsAKUAVCIBMIEASESSDALYDWIEDGDPGPSHICHWZIRFJPMCLMICNHANHMPNISSORPIBPKRPRBMPRERRRTCRTIRTIRPUSAUS$WHOAga Khan UniversityAnnées <strong>de</strong> Vie Corrigées du facteur IncapacitéBody Mass In<strong>de</strong>xEdhi Ambulance ServiceEpworth Sleepiness ScaleDisability-Adjusted Life YearDriving While IntoxicatedEmergency DepartmentGross Domestic ProductGlobal Positioning SystemHigh Income CountryHighway Work ZonesInternational Road Fe<strong>de</strong>rationJinnah Post Graduate Medical CentreLow- and Middle-Income CountryNational Highway Authority, PakistanNational Highway and Motorway Police, PakistanNew Injury Severity ScoreOdds RatioProduit Intérieur BrutPakistani RupeePays <strong>à</strong> Revenu Bas et MoyenPays <strong>à</strong> Revenu ÉlevéRelative RiskRoad Traffic CrashRoad Traffic InjuryRoad Traffic Injury Research & Prevention CentreUnited States of AmericaUS DollarWorld Health Organization8
RésuméIntroduction : La sécurité routière sur le réseau interurbain est un problème majeur <strong>de</strong> santé publique dans lesPays <strong>à</strong> Revenu Bas et Moyen (PRBM) mais peu d'attention y a été consacrée. Les objectifs <strong>de</strong> cette <strong>thèse</strong> étaientd’évaluer le far<strong>de</strong>au <strong>de</strong>s traumatismes en relation avec le trafic interurbain, la déclaration <strong>de</strong>s usagers blessésdans <strong>de</strong>s bases <strong>de</strong> données différentes, d’analyser l’association entre les facteurs situationnels (caractéristiquesphysiques et circonstances environnementales) et les sites <strong>de</strong>s acci<strong>de</strong>nts et la perception <strong>de</strong> la dangerosité <strong>de</strong>stronçons acci<strong>de</strong>ntogènes dans les PRBM. Métho<strong>de</strong>s et résultats : Pour répondre <strong>à</strong> ces objectifs, cinq étu<strong>de</strong>sspécifiques ont été réalisées dans <strong>de</strong>ux PRBM, le Cameroun et le Pakistan. L’étu<strong>de</strong> I a évalué le nombre <strong>de</strong> tuéspar véhicules-km parcourus et les facteurs qui leur étaient associés, en utilisant les rapports <strong>de</strong> police entre 2004et 2007 sur l’axe Yaoundé-Douala, Cameroun. Le taux <strong>de</strong> mortalité était <strong>de</strong> 73 par 100 millions véhicules kmparcourus, un taux 35 fois plus élevé que sur un même type <strong>de</strong> route en pays <strong>à</strong> revenu élevé. La mortalité étaitplus élevée pour les acci<strong>de</strong>nts impliquant <strong>de</strong>s usagers vulnérables, les véhicules roulant en sens opposé et ceuxdus <strong>à</strong> une défaillance mécanique, y compris un éclatement <strong>de</strong> pneu. L’étu<strong>de</strong> II a évalué les différences <strong>de</strong>déclaration d’acci<strong>de</strong>nts faites par les services <strong>de</strong> police, d’ambulance et <strong>de</strong>s urgences en 2008 sur l’axe Karachi-Hala, Pakistan. La mortalité était <strong>de</strong> 53 par 10 9 véhicules-km parcourus ; le taux <strong>de</strong> mortalité était 13 fois plusélevé sur cet axe par rapport <strong>à</strong> un même type <strong>de</strong> route en France. La police a déclaré un mort sur cinq et unblessé grave sur dix. Les usagers <strong>de</strong> la route vulnérables, y compris les piétons et <strong>de</strong>ux-roues ont été <strong>de</strong>ux foismoins déclarés par la police que par les services d'ambulance ou <strong>de</strong>s urgences. L’étu<strong>de</strong> III a étudié les facteurssituationnels associés aux sites <strong>de</strong>s acci<strong>de</strong>nts sur l’axe Yaoundé-Douala par une approche <strong>de</strong> type cas-témoins.Les facteurs tels que le profil routier plat (rapport <strong>de</strong> cotes [RC] ajusté =1,52 ; intervalle <strong>de</strong> confiance <strong>à</strong> 95 %[IC95 %]=1,15-2,04), les surfaces irrégulières (RC=1,43 ; IC95 %=1,04-1,99), les obstacles <strong>à</strong> proximité(RC=1,99 ; IC95 %=1,09-3,63) et les intersections <strong>à</strong> trois (RC=3,11 ; IC95 %=1,15-8,39) ou <strong>à</strong> quatre directions(RC=3,23 ; IC95 %=1,51-6,92) étaient significativement associés <strong>à</strong> <strong>de</strong>s sites d’acci<strong>de</strong>nts corporels. De plus, laprobabilité <strong>de</strong>s acci<strong>de</strong>nts augmentait dans <strong>de</strong>s zones urbaines situées dans <strong>de</strong>s régions <strong>de</strong> plaine (RC=2,23 ;IC95 %=1,97-2,77). L’étu<strong>de</strong> IV a étudié le far<strong>de</strong>au <strong>de</strong>s traumatismes dus aux acci<strong>de</strong>nts ainsi que les facteursassociés dans <strong>de</strong>s zones en travaux sur l’axe Karachi-Hala en utilisant les métho<strong>de</strong>s <strong>de</strong> cohorte historique. Untiers <strong>de</strong> la mortalité routière était survenu dans <strong>de</strong>s zones en travaux et le risque <strong>de</strong> mortalité était quatre fois plusélevé dans ces zones que dans les autres zones. Un acci<strong>de</strong>nt sur <strong>de</strong>ux a eu lieu entre <strong>de</strong>s véhicules roulant en sensopposé dans ces zones. L’étu<strong>de</strong> V a étudié la perception <strong>de</strong> la dangerosité <strong>de</strong>s tronçons acci<strong>de</strong>ntogènes (aumoins 3 acci<strong>de</strong>nts sur 3 ans) et non acci<strong>de</strong>ntogènes (aucun acci<strong>de</strong>nt déclaré) sur les <strong>de</strong>ux axes <strong>de</strong>s précé<strong>de</strong>ntesétu<strong>de</strong>s, en montrant leurs vidéos <strong>à</strong> <strong>de</strong>s conducteurs volontaires pakistanais. Les conducteurs n’ont perçu commedangereux que la moitié <strong>de</strong>s tronçons acci<strong>de</strong>ntogènes. La perception <strong>de</strong> la dangerosité <strong>de</strong>s tronçons plats et droitsétait plus faible par rapport aux tronçons en courbes et avec une pente. La perception <strong>de</strong> la dangerosité en zoneurbaine d’un tronçon acci<strong>de</strong>ntogène était significativement moins élevée (RC=0,58 ; IC95 %=0,51-0,68) quecelle d’un tronçon non acci<strong>de</strong>ntogène ayant la même caractéristique (RC=2,04 ; IC95 %=1,51-2,74). Laperception <strong>de</strong> la dangerosité d’un tronçon acci<strong>de</strong>ntogène avec panneau <strong>de</strong> signalisation était significativementplus élevée (RC=2,75 ; IC95 %=2,38-3,16) par rapport <strong>à</strong> <strong>de</strong>s tronçons non acci<strong>de</strong>ntogènes ayant la mêmecaractéristique (RC=0,50 ; IC95 %=0,34-0,72). Conclusion : Cette <strong>thèse</strong> montre combien <strong>de</strong>s métho<strong>de</strong>sépidémiologiques simples, mais novatrices, peuvent être utiles pour évaluer le far<strong>de</strong>au <strong>de</strong>s traumatismes paracci<strong>de</strong>nts et leurs facteurs <strong>de</strong> risques dans les PRBM. Ces pays sont confrontés <strong>à</strong> un énorme far<strong>de</strong>au <strong>de</strong> morbiditéroutière qui est souvent sous-déclarée dans les données <strong>de</strong> la police. Un système <strong>de</strong> surveillance fiable et vali<strong>de</strong>est nécessaire dans les PRBM. De plus, la politique <strong>de</strong> prévention pourrait être améliorée par une meilleurecommunication d’information entre les autorités routières et policières concernant les facteurs situationnels. Dela même façon, les mesures <strong>de</strong> sécurité dans les zones en travaux <strong>de</strong>vraient être contrôlées par un système dédié.Enfin, la sécurité routière sur les routes interurbaines dans les PRBM pourrait être améliorée en rendant lesroutes plus « informant », en particulier avec l’application <strong>de</strong> mesures peu couteuses telles que les panneaux <strong>de</strong>signalisations sur les tronçons acci<strong>de</strong>ntogènes.Mots Clés: Acci<strong>de</strong>nts <strong>de</strong> la circulation; pays en développement ; trauma; usagers vulnérables.9
AbstractBackground: Interurban traffic safety is a major public health problem, but has received little attention in LowandMiddle-Income Countries (LMICs). The objectives of this thesis were to assess the bur<strong>de</strong>n of injury relatedto interurban traffic, and reporting of these injuries in different datasets, to analyze situational factors (physicalcharacteristics and environmental circumstances) associated with crash sites, and road hazard perception of highriskcrash sites in LMICs. Methods and results: These objectives were assessed in five specific studiesconducted in two LMICs, Cameroon and Pakistan. In study I, traffic fatality per vehicle-km and associated crashfactors were assessed using police reports for years 2004 to 2007, on the two-lane Yaoundé-Douala road sectionin Cameroon. Traffic fatality was 73 per 100 million vehicle-km, a rate 35 times higher than a similar road in ahigh-income country. Fatality was higher for crashes involving vulnerable road users, crashes betweenoppositely-moving vehicles, and those due to mechanical failure including tyre burst. In study II, traffic injuryreporting to police, ambulance, and Emergency Department (ED) in 2008 was assessed, on the four-laneKarachi-Hala road section in Pakistan. Crash fatality was over 53 per 10 9 vehicle-km, a rate 13 times higher thana similar road in France. Police reported only one out of five fatalities and one out of ten severe injuries.Vulnerable road users were two times less reported in police data than ambulance or ED data. In study III,situational factors associated with injury crash sites were assessed on the Yaoundé-Douala road section, usingcase-control methods. Factors such as flat road profiles (adjusted Odds Ratios [OR]=1.52; 95% Confi<strong>de</strong>nceInterval [95%CI]=1.15-2.01), irregular surface conditions (OR=1.43; 95%CI=1.04-1.99), nearby road obstacles(OR=1.99; 95%CI=1.09-3.63), and three- (OR=3.11; 95%CI=1.15-8.39) or four-legged (OR=3.23; 95%CI=1.51-6.92) intersections were significantly associated with injury crash sites. Furthermore, the likelihood of crashincreased with built-up areas situated in plain regions (OR=2.33; 95%CI=1.97-2.77). In study IV, traffic injurybur<strong>de</strong>n and factors associated with Highway Work Zones (HWZs) crashes were assessed on the Karachi-Halaroad section, using historical cohort methods. HWZs accounted for one third of traffic fatalities, and fatality pervehicle-km was four times higher in HWZs than other zones. One out of two HWZ crashes occurred betweenoppositely moving vehicles. In study V, hazard perception of high-risk (with ≥ 3 crashes in 3 years) and low-risksites (no crash reported) from the two above road sections was assessed by showing vi<strong>de</strong>os to voluntaryPakistani drivers. Drivers were able to i<strong>de</strong>ntify only half of the high-risk sites as hazardous. Sites with a flat andstraight road profile had a lower hazard perception compared to those with curved and slope road profile. Highrisksites situated in built-up areas were perceived less hazardous (OR = 0.58; 95%CI=0.51-0.68) compared tolow-risk sites (OR = 2.04; 95%CI=1.51-2.74) with same road situation. Further, high-risk sites with vertical roadsigns were more likely to be perceived hazardous (OR = 2.75; 95%CI=2.38-3.16) than low-risk sites (OR = 0.50;95%CI=0.34-0.72) with such signs. Conclusion: This thesis illustrates how innovative yet simpleepi<strong>de</strong>miological methods can be useful in assessing the injury bur<strong>de</strong>n and specific risk factors in LMICs. Thesecountries face a high bur<strong>de</strong>n of interurban road injuries, mostly un<strong>de</strong>r-reported in police data. A reliable andaccurate injury surveillance system is nee<strong>de</strong>d in these countries. Moreover, prevention policy can be improvedby better information transfer between road and police authorities regarding situational factors. Similarly, amonitoring system is required to examine the HWZ safety interventions in these countries. Lastly, interurbanroad safety can be improved by making roads self-explaining, especially by implementing low-cost interventionssuch as vertical signs at high-risk sites.Keywords: Developing country; highway safety; injury; prevention; vulnerable road users.10
1. IntroductionLes traumatismes routiers sont un problème majeur et pourtant très négligé <strong>de</strong> la santépublique dans les Pays <strong>à</strong> Revenu Bas et Moyen (PRBM) [1]. Une enquête récente sur lasécurité routière dans 178 pays a montré que chaque année plus <strong>de</strong> 90 % <strong>de</strong>s 1,2 million <strong>de</strong>tués sur les routes surviennent dans ces pays [2]. De plus, ces traumatismes sont la principalecause <strong>de</strong> pertes <strong>de</strong>s Années <strong>de</strong> Vie Corrigées du facteur Incapacité (AVCI) dans les PRBM,car <strong>de</strong> nombreux enfants et <strong>de</strong>s hommes en âge <strong>de</strong> production souffrent <strong>de</strong> ces blessures [3].Les traumatismes pourraient coûter jusqu'<strong>à</strong> 1 <strong>à</strong>1,5 % du Produit Intérieur Brut (PIB) <strong>de</strong> cespays [4]. On estime que la mortalité routière augmenterait <strong>de</strong> 80 % entre 1990 et 2020 dansles PRBM, <strong>à</strong> moins que <strong>de</strong>s mesures appropriées soient mises en œuvre [5].Pourtant, le transport routier est un facteur essentiel <strong>de</strong> développement dans les PRBM [6].Près <strong>de</strong> 90 % <strong>de</strong>s voyageurs et du fret dans ces pays sont transportés par le réseau routierurbain et interurbain [6, 7]. La sécurité routière sur ces routes <strong>de</strong>vient donc un élémentstratégique du processus d’accroissement du développement [8]. Même dans les paysdéveloppés, cette catégorie <strong>de</strong> routes contribue considérablement <strong>à</strong> la mortalité routière et <strong>à</strong><strong>de</strong>s blessures graves [9]. Par exemple au Pakistan, plus <strong>de</strong> 27% <strong>de</strong>s acci<strong>de</strong>nts mortelssurviennent sur les routes interurbaines alors qu'elles représentent moins <strong>de</strong> 5 % <strong>de</strong> l'ensembledu réseau [10]. Les avantages potentiels <strong>de</strong> la mise en œuvre <strong>de</strong>s mesures <strong>de</strong> sécurité routièresur ces routes sont potentiellement énormes, comme cela a été montré par <strong>de</strong>s étu<strong>de</strong>s dans lespays développés [11].La recherche joue un rôle central dans la mise en œuvre <strong>de</strong>s interventions sur la circulation[12]. Les conditions routières relativement sûres dans les Pays <strong>à</strong> Revenu Élevé (PRE) doiventbeaucoup aux recherches sur la sécurité routière menées dans les années 1960 et 1970 [13].Par exemple en Suè<strong>de</strong>, il a été démontré que la recherche sur la gestion <strong>de</strong> la vitesse en zonesurbaines a largement contribué <strong>à</strong> réduire la mortalité et la morbidité routières, avec un bonrapport coût-bénéfice [14]. Malheureusement, la recherche sur la prévention et la prise encharge <strong>de</strong>s traumatismes routiers reste encore rudimentaire dans les PRBM [15]. La BanqueMondiale a indiqué que <strong>de</strong>s interventions <strong>à</strong> l'efficacité prouvée existent, mais leur mise enœuvre dans les PRBM est entravée par le manque <strong>de</strong> recherche pour documenter etcomprendre les problèmes spécifiques et locaux <strong>de</strong>s traumatismes [16]. Si les interventions nesont pas adaptées <strong>à</strong> la situation locale, elles peuvent ne pas produire le même succès, commeen témoignent les étu<strong>de</strong>s dans les PRE [17].Le manque <strong>de</strong> recherche dans les PRBM est illustré par notre revue <strong>de</strong> la littérature sur lefar<strong>de</strong>au <strong>de</strong>s traumatismes routiers et les facteurs <strong>de</strong> risque associés aux routes interurbaines(Appendix 1) : les indicateurs comparables <strong>de</strong> la mortalité routier sont rarement évalués etrapportés ; certaines étu<strong>de</strong>s mentionnent une certaine spécificité, comme la sur-implication<strong>de</strong>s piétons et <strong>de</strong>s occupants <strong>de</strong> transports collectifs dans les acci<strong>de</strong>nts sur <strong>de</strong>s routesinterurbaines, mais la répartition réelle <strong>de</strong>s usagers <strong>de</strong> la route impliqués dans ces acci<strong>de</strong>ntsn’est pas connue ; la plupart <strong>de</strong>s étu<strong>de</strong>s épidémiologiques se focalise sur les comportementsroutiers <strong>à</strong> risque alors que les facteurs situationnels (caractéristiques physiques etcirconstances <strong>de</strong> l'environnement) n’ont presque jamais été étudiés [18-48]. Des recherchesantérieures dans les PRE montrent clairement que ces facteurs sont impliqués dans un quart<strong>de</strong>s acci<strong>de</strong>nts et que les interventions mise en œuvre sur les routes pourraient réduire lesacci<strong>de</strong>nts <strong>de</strong> 20 % [49].11
L'objectif <strong>de</strong> cette <strong>thèse</strong> était <strong>de</strong> contribuer <strong>à</strong> une meilleure connaissance du far<strong>de</strong>au <strong>de</strong>straumatismes routiers et <strong>de</strong> leurs déterminants spécifiques dans les PRBM. Pour répondre <strong>à</strong>ces objectifs, cinq étu<strong>de</strong>s <strong>de</strong>scriptives et analytiques ont été réalisées.Le manque <strong>de</strong> données sur les traumatismes <strong>de</strong> la circulation dans les PRBM africains lors <strong>de</strong>la revue <strong>de</strong> la littérature réalisée en 2007 par le responsable <strong>de</strong> l’équipe <strong>de</strong> recherche danslaquelle cette <strong>thèse</strong> a été menée [50], nous a conduit <strong>à</strong> commencer notre travail en décrivantce problème <strong>de</strong> santé publique pour certaines situations spécifiques. Peu d'étu<strong>de</strong>s ayant étépubliées sur la sécurité routière interurbaine <strong>à</strong> l'époque, nous avons commencé par évaluer lacharge d’acci<strong>de</strong>nts <strong>de</strong> la circulation sur l’axe Yaoundé-Douala, Cameroun (étu<strong>de</strong> I). Lesrésultats <strong>de</strong> cette étu<strong>de</strong> nous ont permis <strong>de</strong> mieux apprécier le processus <strong>de</strong> déclarationd'acci<strong>de</strong>nts <strong>de</strong> la circulation dans ce pays. Nous avons répété une étu<strong>de</strong> similaire au Pakistan,mais cette fois nous avons pu recueillir <strong>de</strong>s données provenant <strong>de</strong> sources multiples, ycompris la police, les ambulances et les urgences (étu<strong>de</strong> II). La comparaison <strong>de</strong> ces rapports aété utile pour évaluer les divergences avec les données <strong>de</strong> la police, souvent la seule source <strong>de</strong>rapport sur l'acci<strong>de</strong>nt comme en témoigne l’étu<strong>de</strong> faite au Cameroun.La littérature publiée <strong>à</strong> partir <strong>de</strong>s PRBM et les résultats <strong>de</strong> l'étu<strong>de</strong> du Cameroun ont toujoursmontré une plus faible contribution <strong>de</strong>s facteurs situationnels dans les acci<strong>de</strong>nts que lesinformations rapportées dans les étu<strong>de</strong>s <strong>de</strong> PRE [49]. Malgré cela, nous avons observé quecertains facteurs situationnels ont été fréquemment observés sur les sites d’acci<strong>de</strong>nts. Il estapparu intéressant d'évaluer les facteurs situationnels liés <strong>à</strong> <strong>de</strong>s sites d’acci<strong>de</strong>nts corporels surl’axe Yaoundé-Douala par une étu<strong>de</strong> cas-témoins, une métho<strong>de</strong> jamais utilisée auparavantpour évaluer ces contributions (étu<strong>de</strong> III). De même, la contribution significative d’acci<strong>de</strong>ntssur les zones en travaux nous a conduits <strong>à</strong> évaluer le risque <strong>de</strong> mortalité routière sur ces zonespar rapport aux autres zones. Nous avons évalué ce risque <strong>à</strong> partir d’une étu<strong>de</strong> <strong>de</strong> cohortehistorique (étu<strong>de</strong> IV). Les <strong>de</strong>ux étu<strong>de</strong>s ci-<strong>de</strong>ssus ont montré que les circonstances <strong>de</strong>sacci<strong>de</strong>nts pourraient être mieux expliquées en évaluant les interactions entres les facteurs liésau conducteur et aux situations. Cela nous a suggéré <strong>de</strong> développer et <strong>de</strong> tester une nouvellemétho<strong>de</strong> d'évaluation <strong>de</strong>s interactions entre la perception <strong>de</strong> la dangerosité et les facteurssituationnels sur <strong>de</strong>s tronçons acci<strong>de</strong>ntogènes chez <strong>de</strong>s conducteurs volontaires pakistanais(étu<strong>de</strong> V). Ces étu<strong>de</strong>s réalisées <strong>à</strong> partir d’approches originales <strong>de</strong>vraient permettre <strong>de</strong> mieuxapprécier le far<strong>de</strong>au <strong>de</strong>s traumatismes routiers et d’i<strong>de</strong>ntifier les facteurs situationnels quipourraient être modifiés pour diminuer le risque d’acci<strong>de</strong>nts sur les routes interurbaines dansles PRBM.12
1. IntroductionRoad Traffic Injuries (RTIs) are a major yet highly neglected public health problem in LowandMiddle-Income Countries (LMICs) [1]. A recent road safety survey conductedsimultaneously in 178 countries <strong>de</strong>monstrated that more than 90% of 1.2 million estimatedyearly road fatalities occur in these countries [2]. Further, RTIs are the major cause ofDisability-Adjusted Life Year (DALY) losses in LMICs, because many children and men intheir productive ages suffer these injuries [3]. RTIs could cost a LMIC up to 1-1.5% of itsGross Domestic Product (GDP) [4]. It is expected that road fatalities would increase by 80%from 1990 to 2020 in LMICs, unless appropriate measures are implemented [5].Yet road transport is a crucial <strong>de</strong>terminant of <strong>de</strong>velopment in LMICs [6]. Nearly 90% ofpublic and goods in LMICs are transported through the urban and interurban road network [6,7]. Traffic safety on these roads thus becomes a strategic part of the broa<strong>de</strong>r <strong>de</strong>velopmentprocess [8]. Even in <strong>de</strong>veloped countries, these roads contribute dramatically to trafficfatalities and severe injuries [9]. In Pakistan, for instance more than 27% of the fatal RoadTraffic Crashes (RTCs) occur on interurban roads although these roads represent less than 5%of the entire network [10]. Potential benefits of implementing traffic safety measures on suchroads are potentially enormous, as shown by studies in <strong>de</strong>veloped countries [11].Research plays a pivotal role in implementing traffic interventions [12]. The relative safertravel conditions in High-Income Countries (HIC) owe much to the traffic safety research thathad been carried out in the 1960s and 1970s [13]. For instance in Swe<strong>de</strong>n, it has been<strong>de</strong>monstrated that urban speed management research has contributed substantially in reducingtraffic-related mortality and morbidity, with a good cost-benefit ratio [14]. Unfortunately,injury prevention and control research still remains rudimentary in LMICs [15]. The WorldBank reported that interventions with proven effectiveness exist but their implementation inLMICs is impe<strong>de</strong>d by the lack of research to document and un<strong>de</strong>rstand specific local injuryproblems [16]. If interventions are not adapted to the local situation, they may not yield thesame success evi<strong>de</strong>nced in HICs [17].The lack of research in LMICs is exemplified by our literature review of the RTI bur<strong>de</strong>n andrisk factors associated with interurban roads (Appendix 1): Comparable traffic mortalityindicators are rarely assessed and reported; some studies mention some specificity, such as theover-involvement of pe<strong>de</strong>strians and commercial vehicle occupants in interurban roadcrashes, but the actual road-user distribution involved in such crashes is not known; mostepi<strong>de</strong>miological studies focussed on risky road behaviours and road situational factors(physical characteristics and environmental circumstances) were almost never investigated[18-48]. Previous research in HICs clearly shows that such factors are involved in one fourthof crashes, and that implementing road interventions could reduce crashes by 20% [49].The goal of this thesis was to contribute to a better knowledge of the RTC bur<strong>de</strong>n and specific<strong>de</strong>terminants in LMICs. This was done through <strong>de</strong>scriptive studies assessing the bur<strong>de</strong>n ofRTIs using comparable indicators (studies I & II), analytical studies of situational factorsinvolved in RTCs (studies III & IV), and applying a novel method to assess interactionsbetween situational factors with driver-related characteristics on interurban roads in LMICs(Study V).13
2. Background2.1 Road injury bur<strong>de</strong>n in LMICsA recent World Health Organization (WHO) report showed that road mortality is twice ashigh in LMICs than in HIC (20 vs. 10 per 100 000 inhabitants) [2]. This trend was clearlyvisible when selecting the world most populated nations according to their income groups(Figure 1). Traffic fatality is 4 to 6 times higher in LMICs like Pakistan, Nigeria, and Russiathan in HICs like United Kingdom and France. Among different world regions, LMICssituated in East Mediterranean and African region had the highest traffic mortality rates (32.2per 100 000) as compared to other regions with similar economic situations [2, 5].Furthermore, for every traffic crash <strong>de</strong>ath, many more are injured, with temporary orpermanent disability [51]. For instance in India, for every reported <strong>de</strong>ath, 25 more people arehospitalized due to traffic injuries [52].Figure 1. Traffic fatality per 100 000 inhabitants in various countries [2]JapanUnited KingdomGermanyFranceBangla<strong>de</strong>shLow-income countryMiddle-income countryHigh-income countryUnited StatesCountryVietnamIndonesiaChinaIndiaBrasilMexicoRussiaPakistanNigeria0 5 10 15 20 25 30 35Fatality per 100 000 inhabitants2.2 Road safety is a key to <strong>de</strong>velopment in LMICsRTCs are one of the three leading causes of <strong>de</strong>ath worldwi<strong>de</strong> for persons aged 15-45 years[53]. They account for 2.7% of DALY losses worldwi<strong>de</strong>, and 3.7% in middle-incomecountries [53]. Almost half of the traffic fatalities are recor<strong>de</strong>d among vulnerable road users(Figure 2) such as pe<strong>de</strong>strians, bicyclists, and motorcyclists [2]. The impact of RTIs on thesocial fabric within LMICs is not straightforward [54]. Death of a man from a low- or middleincomegroup in their productive age significantly reduces the income of his household andleads to direct and indirect economic losses to the country [3]. Traffic safety is thus more thana health problem, and its improvement in LMICs may have significant consequences onoverall national <strong>de</strong>velopment [8].14
Figure 2. Traffic fatalities according to road user groups in different countries10080%6040200United StatesMexicoRussiaFranceGermanyUnited KingdomJapanCountryBangla<strong>de</strong>shChinaIndiaBrazilIndonesiaOccupants of four wheeled motorized vehicles Vulnerable road users Others2.3 Risk factorsCrash prevention is a priority to reduce RTI bur<strong>de</strong>n [55]. Gordon and Gibson were the firstscientists who classified injuries as a public health problem by clearly <strong>de</strong>fining it in terms ofinteraction between host (road user), agent (vehicle), and environmental factors (1949) [56].William Haddon, Jr., further conceptualized that the involvement of these factors within thephases of influence such as pre-crash, crash, and post crash [56]. Haddon’s matrix provi<strong>de</strong>d ameans to i<strong>de</strong>ntify risk factors and preventive measures [57]. For instance for speeding, whichis one of the foremost factors involved in highway crashes, this matrix i<strong>de</strong>ntifies differentpreventive measures related to road-user, vehicle and environmental factors; these measures,implemented before, during, or after the crash can contribute to the control of RTIs (Table 1).Table 1. The Haddon Matrix applied to highway crashes involving speed (examples ofintervention)Phases Possible outcome FactorsRoad userVehicle an<strong>de</strong>quipmentPre crash Crash prevention Traffic enforcementto reduce speedingCrash Injury prevention Increased restraintusePost crash Life preservation Training possiblebystan<strong>de</strong>rs in firstaid skillsRegular vehiclecontrols to assessbrakingAirbag installationFoldable wind screenfor emergency exitEnvironmentSpeed calmingmeasures orimproved road<strong>de</strong>signImpact-absorbingbarriersPre-hospital andtrauma care system15
2.4 Multiple factors involved in traffic crashesRTCs are usually consequences of multiple factors [49]. Two studies, conductedin<strong>de</strong>pen<strong>de</strong>ntly in the United States and Great Britain, showed that although road user-relatedfactors were i<strong>de</strong>ntified in up to 94% of RTCs, other factors were also involved in a third ofthem (Figure 3) [55]. In most cases, such crashes resulted when both road user- and roadsituational factors (indicated in red) were involved. These situational factors can be fixed roa<strong>de</strong>nvironmental characteristics, such as road geometry, or transient environmentalcircumstances, such as weather, light, or traffic conditions [55]. Current evi<strong>de</strong>nce alsosuggests that interventions on road environment-related factors can prevent driver-relate<strong>de</strong>rrors and violations, the foremost cause of traffic crashes reported elsewhere [58]. In thisregard, the two known approaches are to make roads “self-explaining” and “forgiving” [3].For instance, speeding is clearly facilitated by plain road profile and installation of speedcalmingmeasures in such situations <strong>de</strong>creases crash likelihood by indirectly influencingdrivers to reduce their speeds (self-explaining roads) [11]. Further, installation of impactabsorbing barriers would mitigate the severity of crash if the crash occurs at all (forgivingroads) [14].Figure 3. Contribution of risk factors in road traffic crashes (adapted from [55])Great BritainUnited States of AmericaRoad an<strong>de</strong>nvironment28%Vehicle8%Road an<strong>de</strong>nvironment34%Vehicle12%2 123 12241427366567Road User94%Road user93%2.5 Implications of interactions for highway safetyHighways are the backbone of the economy in all countries. In absence of effective railwaysand motorways, mixed dual- and single-roads are the major link for almost all transportationof consumables from farms to markets [6]. These roads are over-involved in crash fatalities.For instance in the United States of America (USA), 54% of traffic fatalities occur on suchtype of road sections [59], similarly, interurban road sections in France account for one thirdof road crashes but two thirds of road fatalities (Table 2) [9]. Undoubtedly, severity of trafficcrashes on these roads is higher than those on urban roads. The key <strong>de</strong>terminant of the highcrash fatality is travel speed, itself allowed on these road types [19, 24]. Relationship between16
oad situational factors, high speed, and crash locations has also been <strong>de</strong>monstrated on ruralroads in HICs [60].Table 2. Traffic fatalities according to road network type in France, 2004Road network Injury crashes Deaths Crash severity*Urban roads 57 825 1 451 2.5Rural roads 27 565 3 781 13.7Motorways 8 182 584 7.1National roads 5 436 951 17.5District roads 13 947 2 246 16.1* Fatality per crash × 100Traffic prevention on these road sections implies preventing risky road behaviours [61]. Road<strong>de</strong>sign, surface, markings, furniture, and traffic management play an important role inreducing crash likelihood by reducing the inappropriate road user behaviours on these roadsections [60]. Previous research in <strong>de</strong>veloped countries has clearly <strong>de</strong>monstrated thatengineering measures were highly cost effective in reducing injury crashes compared to thosetargeting only road behaviours or vehicle factors [49]. A British study showed that completeupgrading of national highways to motorways reduced crashes by 76% and traffic fatalities by81% [62]. Similarly, installation of wired guardrail reduced the likelihood of head-on crasheson undivi<strong>de</strong>d rural road sections in Swe<strong>de</strong>n [14]. However, <strong>de</strong>velopment of these measuresrequires rigorous research methods to assess their appropriateness to local traffic conditionsand <strong>de</strong>mands [14, 16].2.6 Factors limiting implementation of engineering measures in LMICsHighway traffic safety has not received appropriate attention in LMICs, both in terms ofestimating the injury bur<strong>de</strong>n and assessing risk factors [11]. Some of the few studiesconducted in such settings suggest that these road sections are important concentrations oftraffic crashes in LMICs, probably due to over-involvement of vulnerable road users [17, 19,63]. Although there is evi<strong>de</strong>nce of an increasing injury bur<strong>de</strong>n, adaptation and implementationof proven engineering interventions in LMICs is impe<strong>de</strong>d by major knowledge gaps [50]:Firstly, reporting of injuries and availability of RTC and RTI data remains in general the mostimportant difficulty in LMICs. A study in Pakistan showed that police statistics accounts foronly 56% of traffic fatalities and 4% of severe injuries in urban settings [64]. Similar resultswere observed in Iran where the official data source for traffic fatalities was compared withhealth facility data [65]. As most LMICs do not have vital registration data, WHO recentlyestimated traffic fatalities in those countries while including information on traffic exposure,risk, preventive, and mitigating factors in their mo<strong>de</strong>l [2]. The results showed that in mosthighly populated LMICs, official statistics inclu<strong>de</strong>d only half or less of the actual trafficfatalities occurred in those countries (Figure 4). Thus, without proper estimates, it becomesvery difficult to advocate for preventive measures in these countries [50].17
Figure 4. Percentage difference of crash fatalities between official reported an<strong>de</strong>stimated figures (adapted from WHO, 2009 [2])100Un<strong>de</strong>r reporting %*1010.1EthiopiaNigeriaPakistanBangla<strong>de</strong>shIndonesiaChinaCountryEgyptIndiaTurkey* (Estimated <strong>de</strong>aths – reported <strong>de</strong>aths) / reported <strong>de</strong>athsAlmost all of the countries use secondary datasets from police, health, or transport<strong>de</strong>partments to assess traffic fatalities and injuries. It becomes equally difficult to obtaindisaggregated data on highways, unless appropriate steps, as practiced in the France [9] andthe USA [55], are taken for data collection. Further, <strong>de</strong>lays in publication of data, inherent totheir collection, pose problems for measuring the impact of interventions [6].Among secondary datasets, police statistics are used in more than 50% of the countries,particularly LMICs [2]. The problem with police data is that their main focus is to <strong>de</strong>terminehuman responsibility for a given crash, and not to assess all contributory factors [7]. Previousstudies in LMICs have shown that the situational factors for which cost-effective engineeringmeasures exist are less likely to be i<strong>de</strong>ntified in crash reports (Figure 5) [7]. Similarly hospitaldata, that report more fatalities than police data [66], do not provi<strong>de</strong>, in most cases,information on crash circumstances, location, or the use of safety <strong>de</strong>vices during the crash[43]. This again leads to knowledge gaps regarding which injury control measures would besuitable for the affected population.18
Figure 5. Causes of road crashes as <strong>de</strong>termined by the police in <strong>de</strong>veloping countries(adapted from Wootton and Jacobs 1996 [7])10080%6040200Cyprus (1982)Botswana (1982)Pakistan (1984)Zimbabwe (1979)Malaysia (1985)Philippines (1984)Ethiopia (1982)Country (Year)India (1980)Afghanistan (1984)Road user Vehicle <strong>de</strong>fects Road factors OtherIran (1984)Another limitation to choose and implement interventions is the unavailability of expositionmeasures such as vehicle-kilometres (vehicle-km) driven on highways in LMICs [6]. Withoutthese measures, it is difficult to compare traffic safety experience of highways in LMICs tothose in HICs. Exposition measures allow to document injury experience for specific vehiclessuspected to be over-involved in crashes [11]. Moreover, even if policy makers wouldimplement preventive interventions, outcome measures in terms of lives saved or injuriesprevented could not be adjusted for change in exposition in the post-intervention phase [17].Last but not least, the approach of traffic safety is different in LMICs and in HICs, and needsspecific research. For instance, although vulnerable road users account for a majority of trafficfatalities in LMICs [11], traffic separation interventions such as construction of accesscontrolled roads for intercity travel would divi<strong>de</strong> the local population in two zones [17]. Asthe people from LMICs are mostly less motorized, those crossing such road sections willexpose themselves to high-speed vehicles and injury risk. Further, the costs of mostinterventions from HICs are often enormous, thus make their implementation difficult inLMICs [17, 62]. Injury prevention interventions need to be adapted to the local situation inLMICs [16]. Little research has been carried out to assess the local factors and potentialbenefit of related interventions in LMICs. For instance, out of 236 studies evaluating trafficsafety interventions, only six were from the LMICs [67]. Injury research funding, even in theUS, does not correspond to the bur<strong>de</strong>n, and LMICs are far behind in placing injuries on theirresearch agenda [16, 68]. Thus research should focus on <strong>de</strong>termining the crash bur<strong>de</strong>n offactors involved as well as the <strong>de</strong>velopment of appropriate interventions in LMICs [50].19
2.7 Interurban road safety research gaps in LMICsTo our knowledge, no review on the epi<strong>de</strong>miology of interurban RTC in LMICs wasavailable. As part of a systematic review of original studies published in Medline® withinterurban road settings (Appendix 1), we only found 31 articles from these countries. Most ofthem used police or health data to assess crash bur<strong>de</strong>n. We did not find any study comparingdifferences in injury reporting between these types of data. Only one study reported injurybur<strong>de</strong>n per 100 million vehicle-km. Situational factors other than the light or weatherconditions were almost never documented in these studies. None of them assessed theinteractions between driver- and road-related crash factors. Only few studies assessed highriskcrash site i<strong>de</strong>ntification methods on inter-urban road sections in LMICs. Finally, few roadinterventions were assessed in these countries, mostly by non comparative methods.3. ObjectivesTo contribute to filling the research gaps on RTCs and RTIs in LMICs, the objectives of thisthesis were:1. To assess the road crash and injury bur<strong>de</strong>n on selected interurban roads in LMICs–Studies I & II;2. To <strong>de</strong>scribe road user groups and situational factors involved in interurban roadcrashes–Studies I & II;3. To assess the association of situational factors with injury crashes on selected roads ofLMICs–Studies III & IV;4. To assess the road hazard perception of the high-risk crash sites in voluntary drivers–Study V.The thesis presents two <strong>de</strong>scriptive studies (I & II) and three analytical studies (III-V) in linewith these objectives. In study I, the crash bur<strong>de</strong>n, number of persons who died or wereinjured per vehicle-km was assessed on Yaoundé-Douala road section in Cameroon. Further,associated crash factors and types were <strong>de</strong>scribed using police reports. In study II, wecompared RTIs per vehicle-km reported to police, ambulance, and hospital on Karachi-Halaroad section during a one-year period. In study III, we assessed situational factors associatedwith injury crash sites using case-control methods on the Yaoundé-Douala road section. Instudy IV, we compared the inci<strong>de</strong>nce <strong>de</strong>nsity rates estimated from events (crash, fatality, andsevere injury) and vehicle-km between highway work zones and other traffic zones onKarachi-Hala road section. In study V, we assessed the hazard perception of high-risk crashsites and those not involved in crashes from the above two road sections by showing theirvi<strong>de</strong>os to voluntary Pakistani drivers. Furthermore, situational factors associated with drivers’hazard perception were assessed using multivariate mo<strong>de</strong>ls. Study I and III have beenpublished whereas manuscript of study IV is un<strong>de</strong>r review and those for study II and V are inpreparation.20
4. Descriptive studiesThe paucity of traffic injury data in African LMICs, as discussed in the literature reviewpublished in 2007 by the head of the research team in which this thesis was conducted [50],ma<strong>de</strong> interesting for us to start our work by <strong>de</strong>scribing this public health problem for somespecific setting. Since few studies were published on interurban traffic safety at that time, westarted by assessing traffic crash bur<strong>de</strong>n on Yaoundé-Douala road section, Cameroon (StudyI). Results from this study permitted us to better appreciate the process of traffic injuryreporting in this country. We repeated a similar study in Pakistan, but this time we were ableto collect RTI data from multiple sources including police, ambulance, and hospitals (StudyII). Comparison of injury reporting was useful to assess discrepancies in police data, often theonly source of crash reporting as evi<strong>de</strong>nced in Cameroon.4.1 Study I: Traffic crash and injury bur<strong>de</strong>n on Yaoundé-Douala roadsection, CameroonLocated in Central and West Africa on the Gulf of Guinea, Cameroon covers an area of475 440 square kilometres and has a population of nearly 19 million inhabitants. Cameroonhas one of the ten highest per capita GDPs—about 2 300 US$ (2008)—in sub-Saharan Africa.The life expectancy at birth is 54 years [69]. The total road network is 50 000 km long, withonly 10% paved [69]. Its interurban road network is highly strategic in the region as it isexpected that its economy will grow substantially in coming years, with increasing oil importsfrom Chad and industrialization [70].Cameroon is in pre-motorization stage with 16.8 registered vehicles per 1 000 persons [2]. Anincreasing trend in crash fatalities has been observed in Cameroon since 1970s [3]. Trafficfatalities increased from un<strong>de</strong>r 400 in 1972 to over 1 150 in 2005 [2]. Over half of those whodied are passengers and drivers of four-wheeled vehicles, whereas pe<strong>de</strong>strians, cyclists, andmotorcyclists account for the rest of <strong>de</strong>aths [2]. A recent estimate suggested that actual trafficfatalities could be around five thousand per year in Cameroon [2]. Speed limit, drunk-driving,seat-belt, and helmet laws are poorly enforced [71].The formal pre-hospital care system is stillin <strong>de</strong>velopment and RTCs are the principal reason for such interventions in urban settings[71].Traffic safety on interurban road network is increasingly becoming the matter of publicconcern in Cameroon. Crashes that drew extensive public attention were mostly thoseinvolving public transportation vehicles with several fatalities [72]. When our study wasstarted, no comparative fatality and injury estimates were available for these road sections.Further, no <strong>de</strong>scription was available in the literature of crash types, causes, and road usersinvolved. Several reasons could explain unavailability of this information: firstly, not allconcerned police reports were forwar<strong>de</strong>d to the <strong>de</strong>partment in charge of traffic injurysurveillance and, secondly, no <strong>de</strong>tailed data were neither collected nor analyzed at the nationallevel, that could provi<strong>de</strong> a better picture of traffic safety on interurban roads [72].21
ObjectivesThe objectives of this first study were:1. To assess crash bur<strong>de</strong>n on an interurban road section in Cameroon.2. To <strong>de</strong>scribe crash types, causes, and situational factors.3. To <strong>de</strong>scribe outcome of traffic injuries, according to road user-related factors.This study was published as: Sobngwi-Tambekou J, Bhatti J, Kounga G, Salmi L-R, Lagar<strong>de</strong>E. Road traffic crashes on the Yaoundé–Douala road section, Cameroon. Acci<strong>de</strong>nt Analysisand Prevention 2010;42(2):422-6 (Appendix 2).The data was collected un<strong>de</strong>r supervision of Dr. Sobngwi-Tambekou and Dr. Lagar<strong>de</strong>. Icontributed to the analysis and manuscript writing.MethodsSetting and study <strong>de</strong>signThe study settings were the Yaoundé-Douala road section. This 243-km long, mostly twolane,un-separated road section serves as a major link between two most populous cities of thecountry, Yaoundé and Douala. To assess road bur<strong>de</strong>n and <strong>de</strong>scribe factors involved inhighway crashes, traffic and crash data from road authorities and highway police stations wasretrospectively collected.Traffic countsTraffic count surveys were conducted by the Ministry of Public Works, Cameroon, on fivelocations during two seven-day periods in May and November 2005 [73]. Daytime trafficcounts were recor<strong>de</strong>d from 6:00 am to 10:00 pm, whereas night-time counts were recor<strong>de</strong>dfrom 10:00 pm to 6:00 am. All passing vehicles were counted and classified. Results showedthat the daily traffic count varied between 2 269 and 3 553 vehicles on Yaoundé-Douala roadsection; mid-city sections had the lowest traffic counts, and those close to the two main citieshad the highest traffic counts. Personal vehicles accounted for 55%, public transportation for21%, and trucks for 24% of the traffic [73].Police reportsIn June and July 2007, all 13 police stations within and outsi<strong>de</strong> Yaoundé and Douala werevisited to collect police traffic crash reports that had been filed between January 2004 andMay 2007. In principle, a police report is established for all injury crashes and for a number ofnon-injury crashes involving several counterparts, for which property loss and civilresponsibilities are at stake. All police reports retrieved from the police station archives werescanned. The State Defence Secretariat Bureau in Yaoundé, in charge of centralizing policereports in the country, was also visited to seek reports not found in the police stations.As a number of police reports are lost or <strong>de</strong>stroyed, we evaluated the completeness of datacollection by comparing the availability of police reports with crash events reported in themain police station registers. In all police stations, such a register is continuously updatedwith one line for all events related to police interventions. This inclu<strong>de</strong>s RTCs, which arelisted and i<strong>de</strong>ntified by a report number and the corresponding police report number. Becausethe exact crash site is not specified in the registers and some crashes could have occurred on22
secondary roads, the register could not be used to assess the crash rate on the Yaoundé-Douala section. However, the register ma<strong>de</strong> it possible to estimate the completeness of policereports retrieved and digitized. This exercise was only possible in the eight largest policestations and was not conducted in the remaining five smaller ones. All reports from all 13police stations were however inclu<strong>de</strong>d in this study.Data extractionScanned reports were co<strong>de</strong>d, using a grid adapted from the standardized French datasurveillance system [9], and were recor<strong>de</strong>d using EPIINFO 2000 [74]. Crash <strong>de</strong>tails inclu<strong>de</strong>dhour, day, month, and year of crash, number of vehicles and road users involved, situationalfactors such as light and weather conditions, horizontal and vertical road profile, road andshoul<strong>de</strong>r surface conditions, and whether situated in urban zones, at intersection, or near aschool. Involved vehicles were categorized as trucks, personal, utilitarian, and passengervehicles. Involved road users were classified by vehicle type or as pe<strong>de</strong>strians, bicyclists, andmotorcycle ri<strong>de</strong>rs. Outcome of these road-users were gra<strong>de</strong>d by the police as: not injured,slightly injured, seriously injured (when needing hospital admission), and died. Road userrelatedvariables such as age, sex, profession, means of transport to hospital, and road usercategory (driver, passenger and pe<strong>de</strong>strian) were recor<strong>de</strong>d when available. For motorizedvehicle users, information on the use of helmet or seat belt and Driving While Intoxicated(DWI) was recor<strong>de</strong>d. Similarly, for pe<strong>de</strong>strian, information on crossing facilities wasrecor<strong>de</strong>d.In addition, all reports were in<strong>de</strong>pen<strong>de</strong>ntly read by two investigators (Emmanuel Lagar<strong>de</strong> andJöelle Sobngwi-Tambekou), and co<strong>de</strong>d using a standardized grid for crash type, and one ortwo possible causes. No inconsistencies were found for crash type, and when two differentcauses were i<strong>de</strong>ntified by the two investigators, both were recor<strong>de</strong>d. On some occasions, thecrash correspon<strong>de</strong>d to several types (for example, a two-wheel motorized vehicle versus ape<strong>de</strong>strian). Such crash type was therefore co<strong>de</strong>d as the type involving the user of highestvulnerability. The vulnerability <strong>de</strong>creasing or<strong>de</strong>r was: one or more pe<strong>de</strong>strians involved; oneor more two-wheel motorized vehicles; vehicles travelling in opposite directions; singlevehicle running off the road; vehicles travelling in the same direction; one or more still ormanoeuvring vehicle; crash at an intersection).AnalysisCrash and injury risks per 100 million kilometres travelled were computed, with numeratorsbeing numbers of persons or events in the study period, and <strong>de</strong>nominators estimated numberof kilometres travelled on the Yaoundé-Douala road section during the study period [73].These rates were corrected taking into account our estimates of police report completeness, ascompared with the events listed in main police registers. To assess the respective involvementof personal, utility, passenger vehicles and trucks, we divi<strong>de</strong>d the number of vehicles of eachtype involved in non-fatal and fatal crashes by kilometres travelled by same vehicle type.Crash and injury risks for specific vehicle and road user group were compared using rateratios and their 95% confi<strong>de</strong>nce intervals. Injury severity for different road user groups wasassessed by fatality ratio, fatalities per total injured. Percentage increases in traffic fatalitiesand injuries were computed for the year 2006 compared to 2004. Furthermore, proportions ofcrash causes and situational factors were computed according to crash types. Crash fatalityratios and fatality per crash were compared for crash types and causes. Lastly, the outcome ofinjuries was compared according to road user characteristics. Data were analyzed using SASversion 9.1.3 [75].23
ResultsCrash bur<strong>de</strong>nA total of 935 RTCs police reports corresponding to our study period were retrievable from13 police stations. These RTCs could be classified into fatal (N=228), injury (N=428), andmateriel-damage only (N=279) crashes. A total of 3 039 persons were involved in thesecrashes; 12.3% died, and 49.2% were injured. Among those who died (N=374), 74.3% diedimmediately as a result of crash impact, 5.6% died after impact on the crash scene, 2.7% diedduring transportation, and 17.4% died in the hospital. Among the injured (N=1 494), 48.6%were <strong>de</strong>clared as seriously injured in the police report. When these figures were compared fortheir completeness to a total of 1 400 RTCs reported in registers of eight police stations, weestimated that these results accounted for 65.4% of all crashes, 62.7% of injury crashes and76.1% of fatal crashes. With an estimated 655 465 vehicle-km travelled daily, the correctedmortality and morbidity estimates were approximately 73 <strong>de</strong>aths and 240 injuries per 100million vehicle-km travelled (Table 3). Occupants of personal and passenger vehicles wereabout twice as often involved in an injury or fatal crashes than trucks’ occupants. Similarly,the injury and fatality risk was four times higher for occupants of personal and passengervehicles than for trucks’ occupants. Injury severity was higher for vulnerable road users:pe<strong>de</strong>strians (0.43), cyclist (0.36), and motorcyclist (0.25), as compared to other vehicles’occupants (≤ 0.20) (Figure 6).Table 3 Bur<strong>de</strong>n of road traffic crashes and injuries, according to vehicle type onYaoundé-Douala road section (2004-2007)Non fatalFatalCrash risk by vehicleN Rate* RR 95% CI N Rate* RR 95% CI- Truck 86 45 1 53 27 1- Personal vehicle 340 102 2.29 1.81-2.90 142 43 1.55 1.13-2.13- Utilitarian vehicle 85 70 1.56 1.16-2.11 41 34 1.22 0.81-1.84- Passenger vehicle 159 93 2.10 1.61-2.72 84 49 1.80 1.27-2.53Total** 428 69 228 44Injury risk by road user- Passenger- Truck 108 56 1 19 10 1- Personal vehicle 557 167 2.99 2.43-3.67 133 40 4.06 2.51-6.56- Utilitarian vehicle 171 140 2.50 1.97-3.18 22 18 1.83 0.99-3.38- Passenger vehicle 392 230 4.11 3.32-5.09 85 50 5.07 3.08-8.34- Pe<strong>de</strong>strian 77 † 57 †- Cyclist 7 † 4 †- Two-wheeled motorized vehicle 110 † 36 †- Other or unspecified 72 † 18 †Total‡ 1494 240 374 73* Per 100 million vehicle-km† Denominator not available‡ Corrected for un<strong>de</strong>r-reporting as per police registers24
Figure 6. Traffic injury outcome, according to road user group on Yaoundé-Douala road section (2004-2007)1.00Fatality per total injured0.800.600.400.20FatalityInjury0.00Pe<strong>de</strong>strianCyclist*Two-wheeled vehicle*Personal vehicle*Utilitarian vehicle*Road userTruck*Passenger vehicle*Others/unspecified** Driver or occupantTime trendsOver 2004 to 2006, traffic injuries and fatalities increased (Figure 7). For instance, ascompared to 2004 (N=105), a 20% increase in road fatalities was observed in 2006 (N=126).Similarly, the injuries increased from 492 in 2004 to 687 in 2006, a 45% increase. A peak ofRTI occurrence was observed on Friday, Saturday, Sunday, accounting for 55.1% of roadfatalities and 54.4% of RTIs (Appendix 3).25
Figure 7. Monthly trend of traffic fatalities and injuries on the Yaoundé-Doualaroad section (Jan 2004 to May 2007)1009080FatalityInjuries70N6050403020100J F M A M J J A S O N D J F M A M J J A S O N D J F M A M J J A S O N D J F M A M2004 2005 2006 2007Time periodCrash type patternsOut of 935 RTCs, the major crash types were: 1) collisions in the same direction (19.3%);2) single vehicles running off the road (19.2%); 3) collisions of vehicles travelling in oppositedirections (16.7%); and 4) RTCs involving pe<strong>de</strong>strians (15.0%) (Table 4). Crash fatality washigh for those involving collision of vehicles in opposite direction (0.9) and pe<strong>de</strong>striancrashes (0.5) (Appendix 3). In most crashes, road user-related factors, such as hazardousovertaking (28.6%), excessive speed (19.5%), inattention/distraction (14.5%), loss of control(12.8%), and hazardous manoeuvre (12.2%), were i<strong>de</strong>ntified. Vehicle-related factors, such astyre problems and other mechanical causes, were i<strong>de</strong>ntified in 18.0% of crashes.Environmental factors were i<strong>de</strong>ntified in 4.0% of the crashes. Among 99 RTCs where nocause could be i<strong>de</strong>ntified, 44 involved pe<strong>de</strong>strians left without assistance by a run-awayvehicle.Weather conditions were normal for most crashes (81.4%). A significant proportion ofcrashes occurred in built-up areas (41.6%), at intersections (19.3%), and on sections with flatroadprofile (70.7%). Same-direction crashes were frequent with hazardous overtaking(47.5%) and loss of control (22.7%). Running-off-the-road crashes were frequently observedwith tyre (35.0%) and mechanical problems (52.8%), and when shoul<strong>de</strong>r conditions wereirregular (21.3%). Similarly, opposite direction were frequent with hazardous overtaking(56.4%), and pe<strong>de</strong>strian crashes were more frequent than average with inattention anddistraction (29.8%) and in built-up areas (54.3%). Two-wheeled motorized vehicle crasheswere frequent with hazardous overtaking (39.5%), in built-up areas (76.0%), at intersections(29.0%), and with straight road profile 75.3%). Crashes at intersections were frequent withexcessive speed (33.9%), inattention and distraction (62.9%), hazardous manoeuvre (35.5%),built-up areas (77.1%), and straight road profile (79.0%).26
Table 4. Crash types, causes, and situational factors on the Yaoundé-Douala road section (2004-2007)All (N=935)SamedirectionRunning offthe roadOppositedirectionPe<strong>de</strong>strianOther still ormanoeuvringvehicleTwowheeledmotorizedvehicleIntersectionN % (N=181) (N=180) (N=156) (N=141) (N=84) (N=81) (N=62)% % % % % % %CausesHazardous overtaking 268 28.6 47.5 18.3 56.4 5.7 14.3 39.5 8.1Excessive speed 182 19.5 18.8 18.3 18.6 20.6 20.2 12.4 33.9Inattention, distraction 136 14.5 9.4 1.7 1.3 29.8 13.1 21.0 62.9Loss of control 120 12.8 22.7 11.1 16.0 4.3 13.1 11.1 3.2Hazardous manoeuvre 114 12.2 13.3 6.1 7.1 3.6 22.6 22.2 35.5Unsafe parking 74 7.9 8.3 2.8 9.0 2.8 35.7 3.7 3.2Tyre puncture/burst/loss 98 10.5 3.8 35.0 7.1 4.3 1.2 3.7 0.0Other mechanical cause 71 7.8 8.3 52.8 12.8 7.1 10.7 4.9 1.6Environmental factors 37 4.0 5.0 7.2 1.9 6.4 2.4 0.0 0.0Light conditionsLight 552 59.2 58.0 70.4 53.9 57.1 49.4 60.5 54.0Twilight 92 9.9 8.3 10.1 9.0 9.3 16.9 8.6 12.0Night 288 30.9 33.7 19.6 37.2 33.6 33.7 27.4 34.0Weather conditionsNormal 749 81.4 75.6 87.1 75.0 90.4 72.3 93.8 75.8Rain 131 14.2 18.9 9.6 19.7 8.1 16.9 5.0 17.7Other 40 4.6 5.6 3.4 5.3 1.5 10.8 1.3 6.5Built-up area 381 41.6 34.4 18.8 27.5 54.3 46.3 76.0 77.1Intersection 168 19.3 16.5 6.1 7.6 24.0 19.7 29.1 72.1Flat road profile 656 70.7 68.5 65.9 68.6 72.1 77.4 76.3 72.1Straight road profile 570 61.3 61.3 42.7 53.3 68.6 73.8 75.3 79.0Irregular surface condition 7 0.8 1.1 1.1 0.7 0.0 0.0 0.0 3.3Irregular shoul<strong>de</strong>r condition 79 11.1 7.4 21.3 14.8 8.6 9.1 3.1 2.1Nearby school 16 1.7 0.6 1.7 0.0 5.1 0.0 3.7 1.627
Injury outcome patternsMost of injured road users were aged 15-59 years (93.1%) (Table 5). Those aged 0-14 yearsand 60 years or more accounted for 15% of road fatalities. Females accounted for 15.7% ofthose involved, but 25.1% of those injured and 26.2% of those who died. Pe<strong>de</strong>striansaccounted for 5.4% of road users involved in crashes, but 18.4% of those who died. Twentyfive pe<strong>de</strong>strians died while crossing, whereas twelve of them died on the roadsi<strong>de</strong>. Nearlyfour out of five injured persons were transported by private means to the hospital.Ambulances were used to transport 4.0% of those injured and 8.4% of those died. Policeforces evacuated 2.0% of those injured and 6.0% of those who died.Table 5. Traffic injury outcome, according to road-user characteristics, on the Yaoundé-Douala road section (2004-2007)Total Injured DiedN % N % N %Age (y)- 0-14 52 2.4 35 3.8 15 6.5- 15-29 563 25.8 284 30.8 68 29.6- 30-44 1 019 46.8 399 43.3 71 30.9- 45-59 485 22.3 175 19.0 58 25.2- ≥ 60 59 2.7 29 3.1 18 7.8Sex- Male 2 322 84.3 952 74.9 262 73.8- Female 431 15.7 319 25.1 93 26.2Profession- Professional drivers 1 049 52.7 230 29.0 46 35.9- Office managers/employees 442 22.2 219 27.6 24 18.8- Self employed 193 9.7 112 14.1 17 13.3- Manual 127 6.4 97 12.2 15 11.7- Stu<strong>de</strong>nts 74 3.7 53 6.7 15 11.7- Other 107 5.4 82 10.3 11 8.6Road user- Driver 1 673 55.1 436 29.2 98 26.2- Vehicle occupants 1 200 39.5 968 64.8 208 55.6- Pe<strong>de</strong>strian 163 5.4 89 6.0 68 18.2Pre-hospital transport- Not transported 1 297 43.5 116 7.9 63 17.1- Private 1 539 51.7 1 260 85.7 252 68.5- Ambulance 90 3.0 59 4.0 31 8.4- Police force 52 1.7 29 2.0 22 6.0Seat-belt wearing was reported for only three persons out of over three thousand vehicleoccupants. Blood-alcohol concentration of responsible drivers was not systematicallyperformed and no record was available. Apparent DWI was i<strong>de</strong>ntified in only two drivers. Inabout 9.3% of the drivers no driving permit was available. Twenty pe<strong>de</strong>strian died at siteswhere no zebra crossing was available.28
4.2 Study II: Differences in police, ambulance, and emergency <strong>de</strong>partmentreporting of traffic injuries on Karachi-Hala road section, PakistanPakistan located at the junction of Middle-East, South-East Asia, China, and Central AsianStates, is the sixth most populous nation of the world [69]. Approximately 1.4 million RTCsoccurred in Pakistan during 1999, resulting in over 7 000 fatalities [76]. A recent WHO reportshowed that actual traffic fatalities could be 4 to 10 times higher than official statistic [2].Similarly, two in<strong>de</strong>pen<strong>de</strong>nt population-based surveys estimated inci<strong>de</strong>nce of traffic injuriesaround 15 to 17 per 1 000 persons per year [77, 78]; RTIs contribute significantly to the workload in hospitals [79]. The direct cost of RTIs to Pakistani economy is over 1 billon US$ [80].Interurban road sections are the back-bone of Pakistani economy. Its strategic interurban roadnetwork of approximately 8 000 km plays a significant role in transport, as it carries morethan 80% of inland passenger and freight traffic [76, 81]. Although these road sectionsaccount for 4% of the entire network, a high proportion of traffic fatalities (27%) occur onthese road sections [63]. Similarly, previous research in Pakistan has shown that injuryseverity was higher for crashes in rural areas [82]. However, no distinction has been ma<strong>de</strong>whether this refers to interurban or other rural roads. Higher speeds and inappropriategeometrical <strong>de</strong>sign can explain this high fatality ratio, but no comparison indicators wereavailable for these road sections [60].The catchment area for traffic injuries is difficult to <strong>de</strong>fine on interurban road sections inLMICs, and police records remain to date the most reliable source of evaluating interurbanroad safety [7]. The use of police statistics alone can lead to un<strong>de</strong>restimation of road bur<strong>de</strong>nin LMICs, as previously illustrated by linking police and ambulance datasets in Karachi,Pakistan [64]. No notable research has been carried out to compare the differences in injuryreporting while linking different datasets with interurban road settings in LMICs [2, 3].ObjectivesThe objectives of this study were:1. To assess differences for crash and injury reporting in police, ambulance, an<strong>de</strong>mergency <strong>de</strong>partment (ED) datasets on an interurban road section in Pakistan.2. To estimate variations of traffic fatality and injury per vehicle-km travelled whenlinking these datasets.The manuscript of this study is currently prepared for submission: Bhatti JA, Razzak JA,Lagar<strong>de</strong> E, Salmi L.-R. Differences in police, ambulance, and emergency <strong>de</strong>partmentreporting of traffic injuries on Karachi-Hala road, Pakistan (Appendix 4).I have been involved in all steps of this study, from conception, to data collection, analysis,interpretation of results, and manuscript writing.29
MethodsThe study setting was 196-km long Karachi-Hala road section (km 16 to km 212 fromKarachi city centre). This is a four-lane highway, two lanes in each direction. The lanes areseparated by a ground surface, but there are no physical barriers. It has one of the highesttraffic counts in the province, with over 24,000 vehicles per day [83]. This high traffic countcan be explained by the economic activity in Karachi, the most populous city of Pakistan,which accounts for 70% of the government’s revenue through tra<strong>de</strong> and industry [84]. In thisretrospective study, information on traffic injuries reported to Police, ambulance service, andED during 2008 (Jan to Dec) was collected and compared.Police dataSince 2004, the National Highway & Motorway Police (NHMP) ensures traffic enforcementon this 196-km long road section. Administratively, this section is consi<strong>de</strong>red as Sector I ofSouth-Zone of NHMP and is divi<strong>de</strong>d further in four 46- to 51-km-long beats: beat 35 (km 16to 62), beat 34 (63 to 114), beat 33 (115 to 162), and beat 32 (163 to 212). NHMP <strong>de</strong>ploysfour motor vehicles and four patrolling officers in an eight-hour shift on these beats [10].For every crash, a standard acci<strong>de</strong>nt analysis report is filed by the attending NHMP officer[85]. A copy of this report is kept in the NHMP regional office. Similarly, <strong>de</strong>tails on crash andthose involved are recor<strong>de</strong>d on a separate acci<strong>de</strong>nt register. From these reports and registers,information was principally extracted on time, date, location of crash, and whether it wasfatal, involved injury, or was without injury. Similarly, we extracted information on name,age, sex, outcome (<strong>de</strong>ad; severe injury, <strong>de</strong>fined as transported to hospital; and mild injury,<strong>de</strong>fined as not transported to hospital), and hospital brought to (when available) of thoseinvolved in crashes.Ambulance dataAmbulance records were obtained from Edhi Ambulance Service (EAS) logbooks. EAS is thelargest private philanthropic ambulance service in the world [86]. EAS has been providingambulance service to injury patients on this road section for the last 15-20 years. For thispurpose, EAS has established six ambulance posts, mostly near main towns, to provi<strong>de</strong> care totraffic injury patients. Location of these posts are: 1) Sohrab Goth (12 km from Karachicentre), 2) Karachi toll plaza (km 28), 3) Edhi centre (km 56), 4) Nooriabad (km 94), 5) HalaNaka (km 160), and 6) Hala (km 212). This service is freely available to injury patients, andfunds are raised by transporting other patients. Ambulance staff consists of, in most cases,only the driver. A clerk at the post can accompany the driver if he thinks this justified, forinstance in case of crash with multiple patients. Ambulance communicates with emergencypost through wireless system or by cell phone.RTI patients or bystan<strong>de</strong>rs can contact the services using the free emergency access number115, which connects them to the main city centre [86]. Information is then transmitted bywireless or cell phone to nearby posts, which finally dispatches the ambulance(s). Afterreaching the scene, attendants separate injured and <strong>de</strong>ad patients. Those severely injured aretransported to the nearest hospital; preference is given to the government hospital if available.All information on the RTI intervention including crash location, RTI patient i<strong>de</strong>ntity andoutcome is then transmitted by wireless or telephone to the regional centre, which records theinformation in a central log book. We obtained these log books from the regional centre atKarachi. Crash <strong>de</strong>tails such as date, time, location, and whether it was fatal or involved injurywere extracted from these books. Similarly, road user <strong>de</strong>tails such as name, sex, age, user type(pe<strong>de</strong>strian, motorcycle ri<strong>de</strong>r, or vehicle occupant), and outcome (died, including when the30
person died at crash scene, during transport, or at ED; injured and transported, includinghospital taken to; injured and not transported) were extracted from these books.Hospital recordsThe Road Traffic Injury Research & Prevention Centre (RTIRP) at the Jinnah Post GraduateMedical Centre (JPMC) has been working since September 2006 [87]. This centresystematically collects, on standard Performa sheets, information on RTI patients presentingat the ED of the five largest teaching hospitals in Karachi: 1) JPMC, 2) Abbasi ShaheedHospital, 3) Civil Hospital Karachi, 4) Liaqat National Hospital, and 5) The Aga KhanUniversity Hospital.This dataset inclu<strong>de</strong>s information on the crash date, time, and location as well as patient’sname, age, sex, road user group. Further information on whether the patient was wearinghelmet or seat belt was available. The New Injury Severity Score (NISS) [88] and outcome(discharged, admitted/referred, or died) of patients were recor<strong>de</strong>d during their stay in the ED.Information on RTI patients involved in crashes on selected road section was extracted fromthis dataset.AnalysisAll information was recor<strong>de</strong>d on Excel® spreadsheets. We computed percentages for crashand injury patient characteristics for three datasets and compared them with each other. Forthe ED dataset, the distribution of NISS according to the outcome was plotted. Records fromthe three datasets were then matched for crash date, name, age, and sex of RTI patientsinvolved. For matched records, we i<strong>de</strong>ntified changes in outcome. Total <strong>de</strong>aths and injurieswere then assessed while removing the records appearing in two or more datasets.Ascertainment rates for police, ambulance, and ED records as compared to these totalfatalities and injuries were computed. Unique record and traffic counts from NationalHighway Authority (NHA) were used to compute overall traffic fatality and injury rates pervehicle-km for 2008 [83].ResultsCrash outcomeIn 2008, police reported 43 crashes, whereas 255 crashes were reported to EAS and 449 werereported to ED. One out of two police reported crashes (N=19, 44.4%) was fatal, whereas thisproportion was 14.5% (N=37) for those reported to EAS and 10.4% (N=47) for those reportedto ED. No information on crash outcome was available in 13.3% of EAS reported crashes and6.7% of those reported to ED.Injury outcomeA total of 143 RTIs were reported to police, 531 to EAS, and 661 to ED. Monthly trendsindicated higher proportions of RTIs in June and July 2008 (Figure 8). Over half of policereportedinjury patients received hospital care (N=80, 55.9%) (Table 6). Half of these patients(N=40), injured between km 16 and km 120 were treated in Karachi; RTIRP hospitals treated17 of them. Nearly one fifth of RTI patients reported in police records died (N=27, 18.8%),whereas this proportion was 10.4% for EAS and 9.1% for ED reported patients. One fourth ofpolice-reported injury patients (N=25.2%) were not transported to the hospital, whereas thiswas 9.0% for EAS-reported patients (N=48). Out of 661 patients presenting to ED, 47.7%(N=315) arrived by private means, whereas 43.0% (N=284) arrived in ambulances. Policetransported only four of these patients, and no information was available on the remaining 5831
patients. In the ED, those with NISS scores from 4 to 8 had a higher likelihood of hospitaladmission (81.0% vs. 19.0%, P
Figure 9. Outcome of traffic injuries reported to emergency <strong>de</strong>partment according toNew Injury Severity Score (NISS) on Karachi-Hala road section (2008)120100DiedAdmitted80DischargedN60402001 2 3 4 5 6 8 9 10 11 12 13 14 16 17 18 19 21 22 25 26 27 29 33 34 35 38 43 50NISSPatient <strong>de</strong>mographicsNames were available for 67.1% of police- and 78% of EAS-reported injury patients (Table6). Information on age was available for 74.1% of police- and 67.6% of EAS-reported injurypatients. Few records in ED dataset were without names (N=12) and age (N=5). Most injurypatients in the three datasets were aged 16-45 years: 61.5% in police, 55.0% in EAS, and78.1% in ED. Similarly, men accounted for a majority of injuries, up to 92.1% of injurypatients in ED.Road user groupThe proportion of pe<strong>de</strong>strians in police-reported crashes was 3.5% (N=5), whereas this was7.5% in the EAS and 12.7% in the ED. Similarly, the proportion of motorcycle ri<strong>de</strong>rs inpolice reported crashes were 4.2% whereas this was 9.2% in EAS and 30.6% in ED.Occupants of four-wheeled vehicles accounted for a majority of injuries in the three datasets:83.9% in police, 75.9% in EAS and 49.5% in ED. In the ED, only 15.7% (N=21) of the 154injury patients riding motorcycles were wearing helmets. Similarly, only three out of ninetythreefour-wheeled vehicle occupants were wearing a seat belt at time of crash.33
Table 6. Traffic injuries reported to police, ambulance, and emergency <strong>de</strong>partment onKarachi-Hala road section (2008).EmergencyPoliceAmbulance<strong>de</strong>partmentN % N % N %Road traffic crash- Fatal 19 44.1 37 14.5 47 10.4- Not Fatal 24 55.8 184 72.2 372 82.9- Unknown 0 0.0 34 13.3 30 6.7Road traffic injury- Deaths 27 18.8 55 10.4 60 9.1- Transported to hospital 80 55.9 428 80.6 601 90.9- Not transported to hospital 36 25.2 48 9.0 NAName of patient available- Yes 96 67.1 414 78.0 648 98.0- No 47 32.9 117 22.0 13 2.0Age (y)- 0-15 14 9.8 34 6.4 62 9.4- 16-45 88 61.5 292 55.0 516 78.1- >45 4 2.8 33 6.2 78 11.8- Unknown 37 25.9 172 32.4 5 0.7Sex- Male 93 65.0 364 68.5 609 92.1- Female 12 8.4 78 14.7 52 7.9- Unknown 38 26.6 89 16.8 0 0.0Road user group- Pe<strong>de</strong>strian 5 3.5 40 7.5 83 12.7- Motorcycle ri<strong>de</strong>rs 6 4.2 49 9.2 203 30.6- Four-wheeled vehicles’ occupants 120 83.9 403 75.9 327 49.5- Others 0 0.0 1 0.2 4 0.6- Unknown 12 8.4 38 7.2 44 6.6NA – Not applicableMatched recordsA total of 108 patients were found in two or more datasets (Figure 10), including 13 who werefound in all datasets, 28 who were found in police and EAS datasets, and 14 who were foundin both police and ED datasets; 93 records were common between ambulance and EDdatasets. Some discrepancies were observed for outcome of injuries reported in police andambulance records (Table 7): four of the 17 injured in police dataset were reported <strong>de</strong>ad inEAS records. Similarly, one of eight injured in police records was reported <strong>de</strong>ad in EDrecords, and nine of 84 injured patients in EAS were reported <strong>de</strong>ad in ED records.Ascertainment of road fatalities and injuriesBased on matching, 119 unique patients were reported to have died in 2008 on this interurbanroad section (Table 8). Police recor<strong>de</strong>d 22.6%, EAS 46.2% and ED 50.4% of them. Similarly,a total of 1 095 injuries were reported injured in three datasets after i<strong>de</strong>ntifying matched34
ecords. Police accounted for 10.6%, EAS 43.5%, and ED 54.9%. Traffic mortality rate was54 <strong>de</strong>aths per 10 9 vehicle-km and RTI rate was slightly over 500 injuries per 10 9 vehicle-kmon this road section. Matching of nameless police and ambulance records, when any of thecrash dates, time, age, and sex <strong>de</strong>tails was available, <strong>de</strong>creased the overall estimates by 4<strong>de</strong>aths and 73 injuries. Corrected traffic fatality was 53 <strong>de</strong>aths and injuries were 467 per 10 9vehicle-km travelled on this road section.Figure 10. Traffic injuries reported to police, ambulance service, and emergency<strong>de</strong>partments on Karachi-Hala road section in 2008 (N=1 214)PoliceN=14311415 113AmbulanceN=531424 56879HospitalN=661Table 7. Differences in outcome of traffic injury among police, ambulance, an<strong>de</strong>mergency <strong>de</strong>partment for same patient on Karachi-Hala road section, 2008 (N=108)PoliceAmbulanceHospitalInjured Died Discharged Admitted DiedN (%) N (%) N (%) N (%) N (%)Injured 13 46.4 4 14.3 6 42.9 1 7.1 1 7.1Died 0 0.0 11 39.3 0 0.0 0 0.0 6 42.9AmbulanceInjured 49 53.3 26 28.3 9 9.7Died 0 0.0 0 0.0 8 8.7Table 8. Ascertainment of police, ambulance, and emergency <strong>de</strong>partment recordsfor traffic fatalities and injuries on Karachi-Hala road section (N=1 214)Outcome Police Ambulance Hospital Total Rate *N % † N % † N % † N %Deaths 27 22.6 55 46.2 60 50.4 119 9.8 54.4Injuries 116 10.6 476 43.5 601 54.9 1 095 91.2 500.4* per 10 9 km travelled.† Ascertainment rate; record numbers (N) divi<strong>de</strong>d by total (N) for the given outcome.35
5. Analytical StudiesPrevious literature from LMICs, and results from the Cameroon study consistently showed alower contribution of situational factors in crashes than those reported in studies from HICs[49]. Nevertheless, we observed that some situational factors were frequently observed atcrash sites. We thought it interesting to assess situational factors associated with injury crashsites on Yaoundé-Douala road section by case-control study, a method never used previouslyto assess such contributions (Study III). Similarly, a high crash fatality associated with roadsection un<strong>de</strong>rgoing maintenance, ma<strong>de</strong> interesting for us to assess such bur<strong>de</strong>n and compare itwith that of normal traffic using historical cohort study methods (Study IV). Both of theabove studies showed that crash circumstances could be better explained when driver- andsituation-related factors are consi<strong>de</strong>red simultaneously. This suggested us to <strong>de</strong>velop and testa novel method to assess interactions between hazard perception and situational factors athigh-risk crash sites in voluntary Pakistani drivers (Study V).5.1 Study III: Situational factors at traffic crash sites: a case-control studyon Yaoundé-Douala road section, CameroonSituational factors play an important role in <strong>de</strong>termining risk and severity of an RTC [60].Improving road <strong>de</strong>sign for instance, can <strong>de</strong>crease crash risk by increasing road network abilityto compensate for driving errors [62]. Similarly, installation of si<strong>de</strong> impact barriers at curvesor removal of solid objects reduces crash severity. It is estimated from crash data of HICs thatimplementing road interventions can reduce 20% of the preventable RTCs [49].Installation of road interventions in LMICs is often not effectively advocated, due toun<strong>de</strong>rreporting of involved situational factors at crash sites [50]. As discussed earlier, policereports are the most common RTC surveillance mechanism in LMICs, but they tend to focusonly on road user-related crash factors (Figure 5, page 19). In countries like Botswana, India,and Zimbabwe, road factors were reported in only one percent of crashes [7]. Our results fromCameroon showed that road situational factors were i<strong>de</strong>ntified in less than 5% of interurbanroad crashes. A similar proportion was observed for interurban crashes in Pakistan [89].These proportions were certainly less than the expected involvement of such factors incrashes as shown in the USA and Great Britain [55].Moreover, previous traffic safety research in LMICs focused more on transient factors such ascrash time or adverse weather conditions [90]. It was observed that, when situational factorswere reported as a crash cause, adverse weather or reduced visibility were i<strong>de</strong>ntified in overhalf of these crashes [89]. In LMICs, police are not trained to report road factors, informationessential to advocate and implement local as well as area-wi<strong>de</strong> road interventions [7, 91]. Wefound only one cross-sectional study from Brazil, showing that road surface conditions weresignificantly associated with injury crashes on interurban roads [21]. Involvement andcontribution of modifiable situational factors other than weather conditions is rarelyinvestigated in LMICs, particularly using case-control methods [90, 92].36
ObjectivesThe objectives of this study were:1. To assess situational factors associated with injury crashes sites on an interurban roadsection in Cameroon.2. To assess attributable risk proportion for such crash factors.This study has been published as: Bhatti JA, Sobngwi-Tambekou J, Lagar<strong>de</strong> E, Salmi LR.Situational factors associated with road traffic crashes: A case-control study on the Yaoun<strong>de</strong>-Douala road section, Cameroon. International Journal of Injury Control and SafetyPromotion 2010 Mar 30:1-8 (Appendix 5).I contributed principally in data collection from vi<strong>de</strong>os, analysis, interpretation of results, andmanuscript writing.MethodsDesign and settingThis case-control study was conducted on the Yaoundé-Douala road section. This 243-km,undivi<strong>de</strong>d, mostly two-lane road connects the two most populated cities (over one millioninhabitants each); Yaoundé at 750 m above sea level and Douala, the port city. This roadsection passes through several smaller towns (
un<strong>de</strong>r supervision of Dr. Sobngwi-Tambekou and Dr. Lagar<strong>de</strong>. (ii) A second set of variableswas generated from the examination of the vi<strong>de</strong>o recording of the road section, taken duringdaylight hours. Case and control sites were i<strong>de</strong>ntified in the vi<strong>de</strong>o using their GlobalPositioning System (GPS) coordinates as recor<strong>de</strong>d both in the vi<strong>de</strong>o and on the standardizedcoding sheets. Data recor<strong>de</strong>d from vi<strong>de</strong>o watching inclu<strong>de</strong>d: number of lanes, si<strong>de</strong> markings,presence of road drain, type of intersection (four-legged, three-legged, and access),intersection control (sign, signals), intersection treatment (speed calming, improving visibilityby angling the entering si<strong>de</strong> road), speed control measures (speed sign, hazard sign, road signwith rumble strips), the maximum in both directions of the length of straight section (length ofclosest straight section if the site is on a curve), important structures (housing and other nonshopbuildings, shops, toll plaza). I conducted this second step of data extraction from vi<strong>de</strong>orecording, blindly to the case or control status of the sites.AnalysisSituational variables, with the exception of intersection type, important structures at roadsi<strong>de</strong>,and speed control measures, were grouped into two categories. The maximum in bothdirections of the length of straight section at or near the crash and control sites was measuredto account for the potential for vehicles to gather speed. For intersections and sections beforecurves only, the variable indicated whether the maximum in both directions of the straightsection was above vs. below or equal to this value of 85 th percentile of this maximum lengthof straight section.Associations between injury crash site (outcome variable) and situational factors (in<strong>de</strong>pen<strong>de</strong>ntvariables) were <strong>de</strong>termined using logistic regression mo<strong>de</strong>ls. Because controls for casesoccurring in the section closer (the last 10 km) to Douala could not be selected, the data setwas not analyzed as an individually matched case-control study. To control for variations intraffic <strong>de</strong>nsity throughout the road section, the road was divi<strong>de</strong>d into 10 sub-sections of 25 kmin length from Yaoundé to Douala and the corresponding nominal variable was entered as aroad section random effect in the mo<strong>de</strong>ls.We fitted three multivariate mo<strong>de</strong>ls including all variables significantly associated (p
case and control sites, as estimated from Moran’s I statistic (P ≥ 0.12). High crash site <strong>de</strong>nsitywas observed near Yaoundé and on the Edéa-Douala road section (Figure 11).Figure 11. Injury crash site <strong>de</strong>nsity along 25-km stretches of Yaoundé-Douala roadsectionNDoualaEdéaPoumaBoumnyebelYaoundéMbankomoInhabitants per city (,000)>200Site/km1.3-1.4>20-2001.5-2.5 8 m, andintersections were significantly more frequent at case sites than controls (Table 9). Vi<strong>de</strong>oscrutiny showed that shops and schools were more frequent at case sites than controls. Noassociations were observed between lengthy straight sections (>872 m) and case sites.In the mo<strong>de</strong>l including only variables from site visits, crash sites were more likely to belocated at intersections than control sites. Similarly, the crash sites were more likely to belocated in built-up areas as compared to control sites. Similarly, likelihood of crashes on flatroad sections increased when the road was wi<strong>de</strong>r than 8 m as compared to narrow roadsections. Moreover, injury crash likelihood increased in presence of nearby obstacles whenroad surface was irregular than regular. In the mo<strong>de</strong>l including only variables from vi<strong>de</strong>o,crash sites were more likely near shops than control sites.In the mo<strong>de</strong>l including both types of variables (mo<strong>de</strong>l 3), crash sites were more likely to belocated on road sections with flat road profiles, irregular surface conditions, near (< 4 m) solidobstacles, except for crash barriers, and at three- and four-legged intersections (Table 9).Furthermore, crash likelihood increased in built-up areas when verge <strong>de</strong>pth was null ascompared to verge <strong>de</strong>pth more than 0 m. Attributable crash risk proportions were 21.9% forflat road profiles, 11.3% for irregular surface conditions, 5.5% for nearby (< 4 m) obstacles,4.6% for three-legged intersections, and 3.4% for four-legged intersections. Attributable crashrisk proportion was 16.1% for built-up areas as estimated from mo<strong>de</strong>l 1.39
Table 9. Situational variables at case and control sites on Yaoundé-Douala road section, CameroonProportion Proportion P Mo<strong>de</strong>l 1 Mo<strong>de</strong>l 2 Mo<strong>de</strong>l3 Attributableamong controls among cases aOR * [95% CI] aOR * [95% CI] aOR * [95% CI] risk (%)Variables from site visit N=543 N=554Flat vs. hill road profile 53.0 64.1 0 m verge <strong>de</strong>pth (10 m from verge) 39.8 46.2 0.03Straight vs. curved road section 37.2 44.2 0.02Built-up vs. rural road section 35.0 48.9 70° vs. ≤ 70° 23.0 23.3 0.91Lane width > 8 vs. ≤ 8 m 10.1 17.2 2 lanes 91.9 90.1 0.46Speed control 0.02- Speed sign 15.8 17.5- Hazard sign 14.8 20.7- Road sign with rumble strips or speed blocks 2.2 1.9Length of straight road section (>85 vs. < 85 percentile) § 8.2 8.8 0.73Si<strong>de</strong>-road markings 5.1 6.1 0.15Intersection control vs. none (signs, signals, blocks) 3.7 8.9 0.01Presence of a road drain 2.9 2.8 0.77Intersection treatment║ 2.6 4.2 0.18Important structures at roadsi<strong>de</strong>
5.2 Study IV: Bur<strong>de</strong>n and factors associated with highway work zonecrashes, Karachi-Hala road section, PakistanWith aging of highways, road authorities spend a consi<strong>de</strong>rable proportion of their budget ontheir preservation [94]. For instance, fe<strong>de</strong>ral and state highway <strong>de</strong>partments of transportationin the USA invest 10 to 15% of their annual budget on the maintenance of highways,amounting to tens of billions of US$ each year [95, 96]. Similarly, highway maintenancebecomes an essential component of <strong>de</strong>velopment fund spending in LMICs [97, 98]. Theseconstruction zones, often named as Highway Work Zones (HWZs), are present on roadnetworks in all countries [99, 100].In HWZs, road lanes, which are normally available to accommodate the actual traffic flow,are closed, shifted, or encroached upon for construction purposes [99]. Although it is oftenbetter to provi<strong>de</strong> <strong>de</strong>tours to the commuters, this remains impractical in highway settings [99,101]. Thus, traffic flows need to be restricted giving rise to safety challenges [100]. Forinstance, 63% of fatal crashes and one-third of injury crashes took place on HWZs of the twolanehighways in Kansas [100]. In the US, the estimated cost of HWZ crashes between 1995and 1997 was 6.2 billion US$, with an average cost of 3,687 US$ per crash [102]. In HICs,traffic safety issues related to HWZs have been studied in <strong>de</strong>tail, and appropriate trafficcontrol interventions are put in place before the construction begins [103].In Pakistan, the interurban network of over 8 000 km suffers extensively from wear and tearmostly due to overloading, heavy traffic, and <strong>de</strong>layed maintenance [81]. The pavementconditionsurvey conducted in 2001 showed that 50% of the National interurban road networkis in need of major rehabilitation [81]. The maintenance <strong>de</strong>mands have been consistentlyincreased from 10 billion Pakistani rupees (PKR) in 1991 to over 30 billion PKR in 2005, yetslightly over 10 billion PKR were spent in 2005 for highway maintenance [81]. It is highlylikely that a significant proportion of the current road network un<strong>de</strong>rgoes maintenance, but nodata is available to estimate the traffic safety or exposition related to such conditions. Thecase of Pakistan is certainly not different from most LMICs, as almost no research has beencarried out to assess this problem in these countries [3, 90].ObjectivesThe objectives of this study were:1. To assess bur<strong>de</strong>n of HWZ crashes on an interurban road section in Pakistan.2. To assess factors associated with such crashes in Pakistan.This study is un<strong>de</strong>r second revision in Injury Prevention: Bhatti JA, Razzak JA, Lagar<strong>de</strong> E,Salmi L.-R. Bur<strong>de</strong>n and factors associated with highway work-zone crashes, Karachi-Halaroad section, Pakistan. Injury Prevention (Appendix 6).I have been involved in all steps of this study, from conception, to data collection, analysis,interpretation of results, and manuscript writing.41
MethodsStudy <strong>de</strong>sign and settingStudy <strong>de</strong>sign was based on a historical cohort study [104, 105]. Highway police crash reportsand traffic statistics for a three-year period (2006-2008) were used to assess the injury risks inHWZs. The study setting was a 196-km long four-lane, separated, section of the Karachi-Halaroad in the province of Sindh, Pakistan (Figure 12). This is one of the most heavily used roadsections, with traffic counts ranging from 16,356 to 24,707 vehicles per day [83]. The NHAPakistan manages maintenance and upgrading operations on this road section. The NHMPhave been enforcing traffic rules on this road section since 2004.Figure 12. Karachi-Hala Road Section, province of Sindh, PakistanChinaBaluchistanIndiaAfghanistanIndiaArabian seaSelected roadOther roadBoundriesCitiesArabian SeaTraffic dataAnnual average daily traffic survey data were collected from NHA headquarters. Thesesurveys are conducted each year to assess traffic counts on different road sections un<strong>de</strong>rFe<strong>de</strong>ral administration. Locations near toll plazas are selected to assess 24-hour counts byNHA personnel. We extracted information on traffic counts observed between Karachi-Hy<strong>de</strong>rabad (146 km) and Hy<strong>de</strong>rabad-Hala (50 km) sub-sections. Variables inclu<strong>de</strong>d in trafficsurveys were number, type (trucks, buses transporting ≥ 20 passengers, mini-truck, minibus orcoasters transporting < 20 passengers, cars or jeeps, and motorcycles), and direction ofvehicles (North-bound or South-bound) [83].In Pakistan, during maintenance works on separated interurban roads, two or more lanes in agiven direction are completely blocked and traffic, on most occasions, is diverted tooppositely directed lanes (Figure 13). Police and highway authorities facilitate privatecontracting agencies in traffic control during construction periods. Details of HWZ start an<strong>de</strong>nd dates and km locations are recor<strong>de</strong>d in their memos. We collected this data from NHAand NHMP regional offices.42
Figure 13. Examples of normal traffic zone (A) and work zone (B) on interurban roadsection in the province of Sindh, PakistanABCrash dataAfter a crash, a NHMP patrolling officer files the <strong>de</strong>tails of crash on a standard four-pageacci<strong>de</strong>nt analysis report [85]. A copy of this report is kept in the regional office, whereas theoriginal is sent to the NHA headquarters. Moreover, each crash is recor<strong>de</strong>d on a separateacci<strong>de</strong>nt register in the regional office [85]. All police crash reports and registers from Jan 0643
to Dec 08 were retrieved and photocopied from regional NHMP offices with permission ofthe officer in charge.Variables co<strong>de</strong>d from acci<strong>de</strong>nt registers inclu<strong>de</strong>d date, time, number and type of involvedvehicles, number of persons injured or who died in a reported crash, and whether crashoccurred during maintenance works. Variables co<strong>de</strong>d from crash reports inclu<strong>de</strong>d date, time,location, direction of lane (North-bound or South-bound), light, weather, horizontal andvertical road profile, road surface and shoul<strong>de</strong>r condition, ongoing maintenance, and crashcause [106].Type of crash was <strong>de</strong>fined as single vehicle, same direction, opposite direction,si<strong>de</strong>wise, pe<strong>de</strong>strian. When more than one type was i<strong>de</strong>ntified, crashes were co<strong>de</strong>d as crash ofmost vulnerable involved road user; the vulnerability <strong>de</strong>creasing or<strong>de</strong>r was: pe<strong>de</strong>strian;opposite direction; si<strong>de</strong>wise or at intersection; single vehicle; same direction [106]. Details onnumber, injury severity, and type of road user involved (pe<strong>de</strong>strian, ri<strong>de</strong>rs of two-wheelers, oroccupants of cars/jeeps, minibuses, buses, or trucks) were co<strong>de</strong>d separately. Severity was<strong>de</strong>fined as ‘severe’ when involved person was transported to hospital and ‘fatal’ wheninvolved road user died at crash scene or at hospital in first 24 hours of the event [85].AnalysisInformation on crashes from registers and reports were linked to make a single file based oncrash location (km) and crash date, available for all crashes. Crash, fatality, and severe injuryper 10 9 vehicle-km travelled for vehicle type and direction were computed using traffic countssurvey [83]. Proportion of crashes, fatalities, and injuries on HWZ were computed andcompared to other zones. Information on HWZ dates was only available for the Hy<strong>de</strong>rabad-Hala sub-section. Due to this limitation, crash, fatality and injury rates for work and normaltraffic zone were computed only for the 50-km-long sub-section. Crash, fatality, and severeinjury risks according to road directions, vehicle types and traffic conditions were comparedusing rate ratios with 95% confi<strong>de</strong>nce intervals, rate differences, and attributable riskproportions where appropriate [104, 107]. Associations of factors with HWZs crashes wereestimated from a multiple logistic regression mo<strong>de</strong>l, including all variables weakly associated(P
Table 10. Road crash fatality and injury risk per 10 9 vehicle-km on the Karachi-Halaroad section, Pakistan (2006-08)Vehicle-km Crash Fatality Severe injury10 9 N Rate* N Rate* N Rate*All (except work zone) 4.84 153 31.6 63 13.0 287 59.3-North-bound direction 2.40 98 40.8 38 15.8 191 79.6-South-bound direction 2.44 55 22.5 25 10.2 96 39.3Vehicle †-Motorcycle 0.19 10 52.6 8 42.1 10 52.6-Car/jeep 1.90 60 31.6 29 15.3 107 56.3-Mini-van (
normal zones. However, this association was not observed when these two sub-sections wereanalyzed separately. Moreover, as compared to other traffic crashes, hazardous overtakingwas the most common cause of HWZ crashes (55.6% vs. 7.1%).Table 12. Factors associated with work-zone crashes on the 196-km-long Karachi-Halaroad section, Pakistan (2006-08)Work-zone crashes Other crashes P Adjusted 95%CI *N=27 N=141 odds ratioN (%) N (%)Severity 0.003- Mild or no injury 0 0.0 20 14.2- Severe injury 10 37.0 77 54.6- Death 17 63.0 44 31.2Crash type
5.3 Study V: Road hazard perception at high-risk crash sites in voluntaryPakistani driversTraffic crashes are unevenly distributed along interurban road networks [3]. They occur inclusters at single sites , often called high-risk sites or zones, along particular sections of theroad [109]. They can be <strong>de</strong>fined as sites having a higher expected number of crashes thanother similar sites [110]. Theoretically, inadaptability of driving behaviour to local road andtraffic hazards leads to crashes at these sites [109]. It has been documented that <strong>de</strong>signimprovement at these sites can result in significant <strong>de</strong>creases in crash risk [11]. However, thisremains an expensive option and not all high-risk sites can be improved in a timely manner[111].Hazard perception is the driver’s ability to i<strong>de</strong>ntify potential hazardous situations and takingnecessary actions to avoid them [112, 113]. Driver-related factors such as age, sex, familiaritywith road, driving experience, attitu<strong>de</strong>s, and self-assessment of skills can influence this ability[114-119]. Road elements such as sharp bends, <strong>de</strong>creased widths, and presence of lanemarkings can increase hazard perception [120, 121]. Previous research has shown thataugmenting hazard perception by driver training or by implementing appropriate roadfurniture could significantly reduce the likelihood of RTCs [122, 123].Much work on high-risk crash sites focused on i<strong>de</strong>ntifying these sites using statisticalmethods so that safety work could be prioritized [124]. Interactions between driver- and siterelatedfactors has not been investigated in <strong>de</strong>tail, particularly for the interurban road settingsin LMICs [49]. To our knowledge, the hypothesis that high-risk crash sites might not beperceived as dangerous by drivers has not been tested as yet. Insight into how such sites areperceived by drivers could be useful in <strong>de</strong>veloping and implementing less expensiveinterventions, particularly in LMICs [116].ObjectivesThe objectives of this study were:1. To compare hazard perceptions of high-risk crash sites to those not involved incrashes in voluntary drivers.2. To assess driver- and site-related factors associated with hazard perception level.3. To assess whether associations between factors and hazard perception were differentat high-risk crash sites and at sites not involved in crashes.The manuscript of this study is currently prepared for submission to Health Psychology:Bhatti JA, Razzak JA, Lagar<strong>de</strong> E, Sobngwi-Tambekou J, Alioum A, Salmi L.-R. Hazardperception at high- and low-risk crash sites (Appendix 7).I have been principally involved in study conception, analysis, interpretation of results, andmanuscript writing. Site and vi<strong>de</strong>o data from Cameroon was collected un<strong>de</strong>r supervision ofDr. Sobngwi-Tambekou and Dr. Lagar<strong>de</strong>. Site, vi<strong>de</strong>o, and participant data from Pakistan wascollected un<strong>de</strong>r my direct supervision.47
MethodsStudy <strong>de</strong>sign and settingsThe study settings were interurban road sections situated in Cameroon and Pakistan:1/ Karachi-Hala road section in Pakistan (196-km-long mostly four-lane separated road), and2/ Yaoundé-Douala road section in Cameroon (243-km-long mostly two-lane non-separatedroad). A matched strategy was used to select sites. ‘High-risk sites’ were those involved inthree or more RTCs in a prece<strong>de</strong>nt three-year period, whereas ‘low-risk sites’ were those notinvolved in a RTC, during the same period. For each high-risk site, a low-risk site wasrandomly selected on the same road section. Hazard perception was assessed by showingvi<strong>de</strong>os of these sites to voluntary Pakistani drivers. Ethical approval of the study was obtainedfrom the Aga Khan University Ethics Research Committee in May 2009 (ReferenceERC/2009/1179).Site selectionIn Pakistan, NHMP regional office was visited in the month of June 2009. Crash reports andregisters for the three-year period from Jan 1, 2006 to Dec 12, 2008 were retrieved andphotocopied. High-risk sites with given kilometre location were then i<strong>de</strong>ntified with GPScoordinates with help of a police officer. Similarly, traffic police offices in Cameroon werevisited and such sites were subsequently i<strong>de</strong>ntified in June 2007. The two road sections werefilmed from a four-wheeled sedan car moving within the authorized speed limit (July 2009 inPakistan and July 2007 in Cameroon). All high- and low-risk sites were then i<strong>de</strong>ntified bylinking GPS coordinates to the vi<strong>de</strong>os. For each high-risk site, a low-risk site was randomlyselected out of all sites which were not involved in crashes on the same road section.Vi<strong>de</strong>o setsTo measure hazard perception, vi<strong>de</strong>o of sites were cut so that each vi<strong>de</strong>o showed a 500 metrelong-roadsection during 30 seconds, including the last 100 m corresponding to the high- orlow-risk site (Figure 14). Further, a yellow indicator blinked five times to help drivers i<strong>de</strong>ntifythe site for which they had to emit a judgement on hazard perception right after vi<strong>de</strong>oprojection. We <strong>de</strong>termined sample size to be 26 pairs of sites, assuming that 95% of the highrisksites would be i<strong>de</strong>ntified as dangerous and 80% of the low-risk sites as not dangerouswith a precision of 7.5 [125].Participant selectionParticipants were Pakistani nationals residing in Karachi, aged 18 years or more, with a validdriving permit, who had driven a motorized vehicle on the Karachi-Hala road section in theprevious seven days. Random sampling was not possible because of heavy-traffic and higherspeeds conditions on this road section [30]. Thus, a convenience, but representative, samplingmethod was used to recruit 100 drivers. For this, we <strong>de</strong>termined the drivers’ sex and vehiculardistribution by observing traffic from a pilot study (N=5 496). It was observed that carsaccounted for 39.1%, heavy trucks for 36.5%, minibuses and mini-trucks for 7.8%, buses for9.6%, and motorcycles for 6.3% of the vehicles entering Karachi (Appendix 8). Distributionof cars and heavy vehicles was similar to that recor<strong>de</strong>d by highway authority [83]. Almost alldrivers were men (99.9%). Based on these findings, personal vehicle male drivers wereinvited from a roadsi<strong>de</strong> gas station at start of the highway near Karachi, and commercialvehicle drivers were invited from transport company offices at six different locations inKarachi.Data collectionFace-to-face interviews with drivers were conducted in Urdu language. Questions were<strong>de</strong>veloped from an English language questionnaire, using back translation, in<strong>de</strong>pen<strong>de</strong>ntlinguistic verification, and testing on five drivers. Interviews were either conducted at the Aga48
Khan University (AKU) Campus or at the company offices in separate rooms. Driver-relatedvariables inclu<strong>de</strong>d socio-<strong>de</strong>mographic variables (age, sex, marital status, education, an<strong>de</strong>mployment), whether driving permit was issued without practical test, frequency of reportedrisky driving behaviours (sleepy driving, mobile phone use while driving, seat-belt use, traffictickets, DWI during last three months), and involvement in RTC during last one year.Using 17-inch vi<strong>de</strong>o screens, five test vi<strong>de</strong>os (three from Pakistan and two from Cameroon)were shown to drivers before presenting selected sites. The or<strong>de</strong>r of sites was randomly drawnfor each participant. To avoid confusion from right- and left-hand driving practiced inCameroon and Pakistan, site vi<strong>de</strong>os from Cameroon followed those from Pakistan. For eachvi<strong>de</strong>o shown, drivers were asked to report their perception of site and traffic, on a four-levelscale; 1) Certainly safe; 2) Probably safe; 3) Probably dangerous; 4) Certainly dangerous(Figure 14). Further, they were asked to record their preferred speed (in km/h) for each site.Each site was characterized by the main investigator, using <strong>de</strong>finitions used in our previousstudy conducted in Cameroon [126]. Site-related variables assessed were built-up or ruralarea, horizontal and vertical road profile, road width, surface regularity, verge slope, <strong>de</strong>pth at10 m from the verge, location and type of nearby obstacles (within a road distance of 50 m ineach direction), horizontal marking, vertical road signs, and presence of an intersection or aU-turn [126]. Traffic-related variables assessed were traffic moving in same or oppositedirection, visible pe<strong>de</strong>strian, motorcyclist, or heavy vehicle, rain or wet surface, manoeuvringvehicle (crossing or overtaking), and number of lanes [127].49
Figure 14. Picture extracted of a high-risk site vi<strong>de</strong>o and related questions, from theKarachi-Hala road section5450
AnalysisProportions of site- and driver-related characteristics were computed. Discordance (D) ofappreciation for a matched high- and low-risk site was <strong>de</strong>fined as “minor” when difference ofhazard perception level was one on the Likert scale and “major” when level difference wasmore than one. Positive sign (D + ) was used to show that hazard perception was higher for thehigh-risk site than its matched low-risk site, and negative sign (D - ) to show that hazardperception was lower for the high-risk site than its matched low-risk site. Wilcoxon test wasused to assess whether these discordances were significantly higher or lower for high-risk sitethan low-risk site. Similarly, differences in reported speeds for matched high- and low-risksite pairs were compared using a paired t test. Correlations between reported speeds for highandlow-risk site pairs were assessed by intra-class correlation coefficient (ICC). Associationsof driver-, site-, and traffic-factors with road hazard perception level 1 were assessed usinglogistic regression with a backward selection strategy including significant (P
located in built-up area in Pakistan (31%) than in Cameroon (50%). Similarly, one third ofhigh-risk sites were at intersection in Pakistan (31%) and Cameroon (40%). In Pakistan, 19%of the high-risk sites were situated at a U-turn and on 13%, maintenance works was ongoing.Table 13. Characteristics of high- and low-risk sites on Yaoundé-Douala and Karachi-Hala road sectionsPakistanCameroonHigh risk (%) Low risk (%) High risk (%) Low risk (%)Characteristics (N=16) (N=16) (N=10) (N=10)Site factorsStraight 87 87 20 50Irregular road shoul<strong>de</strong>r 81 81 100 90Irregular surface conditions 75 63 90 40Lane width ≤ 8 75 100 80 90Flat 62 81 50 60Visible road si<strong>de</strong> obstacle 50 38 100 90Vertical road sign 38 19 40 10Built-up road section 31 56 50 10Intersection 31 31 40 0U-turn 19 19 0 0Diversion 13 6 0 0Continuous road-markings 13 0 50 10Traffic factorsVisible heavy vehicle 88 69 40 40Same direction moving vehicle 81 88 60 60Manoeuvring vehicle (overtake, crossing) 69 56 30 10Opposite direction moving vehicle 25 19 40 50Visible pe<strong>de</strong>strian 19 31 50 20Visible motorcyclists 13 19 10 0Rain 0 0 20 20Wet surface 0 0 70 50ParticipantsOut of 100 participants, 44 were interviewed at the AKU. Most participants were agedbetween 26-45 years and one fifth had received no education (Table 14). While all driverslived in Karachi, 46 of them had a resi<strong>de</strong>nce in other regions of Pakistan as well. Seventy-fourdrivers reported either not wearing a seat-belt at all or wearing it occasionally, and 92 of themreported a cell phone use while driving. No significant association was found for any of thedriver-related factor or interview location with recent crash history.52
Table 14. Characteristics of Pakistani drivers inclu<strong>de</strong>d in sample (N=100).Proportion (%)(N=100)Age (y)-18-25 9 5-26-35 38 30-36-45 28 45- > 45 25 20Vehicle driven-Truck 33 30-Motorcar 43 45-Bus 11 0-Mini-bus 6 15-Mini-truck 5 5-Motorcycle 2 5Permanent domicile-Karachi 54 50-Sindh 9 20-Punjab 29 20-NWFP/Baluchistan 8 10Education (y)- None 22 35- 1-5 22 10- 6-10 37 40- >10 19 15Profession-Driver 85 85-Other 15 15Married 88 80Familiar with road 83 90Licensed after test 45 50Seat-belt use-None 27 20-Occasional 47 55-Frequent 26 25Sleepy driving 29 40Phone dialling 84 80Phone receiving 92 85Traffic Ticket 49 50Drunk driving 2 10Recent crash (%)(N=20)Hazard perception of crash and non crash sitesIn twelve site pairs, five from Pakistan and seven from Cameroon, road hazard perception wassignificantly higher for high-risk than low-risk sites and reported preferred speeds weresignificantly lower for high-risk than low-risk sites (Table 15). Correlations of pair-wisereported speeds were mo<strong>de</strong>rate to high (0.51≥ICC≤0.95). The highest negative speeddifferences (> 25 km/h) were observed for pairs 4 (toll plaza at high-risk site), 16 (built-uparea with markets and traffic at high-risk site), and 24 (a curve, with rain, oil tanker, andparked vehicle on high-risk site) (Appendix 8). Most high-risk sites where site hazardperception was not different or lower than at low-risk sites were straight (N=10) and flat(N=8).53
Table 15. Differences in hazard perception, and reported preferred speeds for high- andlow-risk site pairs on Yaoundé-Douala and Karachi-Hala road sectionsRoad hazard perception Traffic hazard perception Difference in preferred speedD + D ++ D - D -- P D + D ++ D - D -- P Mean P ICC 95% CIPakistan1 16 37 4 5
Table 16. Factors associated with hazard perception of high- and low-risk sites onYaoundé-Douala and Karachi-Hala road sectionsMo<strong>de</strong>l 1 Mo<strong>de</strong>l 2 Mo<strong>de</strong>l 3OR 95% CI OR 95% CI OR 95% CIDriverAge (y)- 18-25 1.93 1.50-2.48 1.95 1.71-2.22 2.09 1.53-2.82- 26-35 1.21 1.03-1.42 1.20 1.12-1.30 1.23 1.02-1.49- 36-45 1 1 1- > 45 1.00 0.84-1.19 1.00 0.91-1.08 1.00 0.81-1.23Vehicle driven- Truck * 1 1- Motorcar 0.71 0.62-0.82 0.70 0.65-0.75 0.69 0.58-0.81- Mini-bus 0.85 0.64-1.13 0.85 0.73-0.98 0.83 0.61-1.16- Mini-truck 0.68 0.50-0.92 0.67 0.58-0.78 0.66 0.46-0.94- Bus 1.38 1.10-1.74 1.39 1.24-1.55 1.40 1.08-1.86SiteCameroon vs. Pakistan 6.53 4.91-8.68 6.88 5.26-9.02 7.61 6.55-8.85Straight vs. curve 0.72 0.58-0.88 0.69 0.56-0.86 0.69 0.62-0.76Irregular vs. regular road surface 4.78 3.74-6.09 4.61 3.71-5.75 5.36 4.71-6.11Flat vs. hill 0.57 0.48-0.69 0.54 0.45-0.65 0.54 0.50-0.60Intersection vs. none 1.46 1.13-1.90 1.40 1.08-1.82 1.49 1.30-1.73Work zone 24.34 15.00-39.51 23.33 14.43-37.71 31.82 24.53-41.26Lane width ≤ 8 m vs. > 8 m- High-risk 0.51 0.43-0.61 0.50 0.37-0.68 0.48 0.42-0.56- Low-risk 18.48 10.39-32.85 22.64 12.42-41.26 23.57 17.29-32.14Built-up area vs. rural- High-risk 0.58 0.51-0.68 0.67 0.49-0.90 0.57 0.46-0.69- Low-risk 2.04 1.51-2.74 2.29 1.69-3.09 2.18 1.86-2.56Vertical road sign- High-risk 2.75 2.38-3.16 2.64 2.02-3.44 2.94 2.48-3.50- Low-risk 0.50 0.34-0.72 0.50 0.36-0.70 0.47 0.39-0.58U-turn- High-risk 8.00 6.36-10.22 7.69 5.09-11.62 9.58 7.50-12.24- Low-risk 0.62 0.39-0.97 0.65 0.43-0.99 0.60 0.47-0.76TrafficHeavy traffic 0.37 0.29-0.47 0.41 0.33-0.51 0.34 0.30-0.39Manoeuvring vehicle 1.91 1.50-2.42 1.82 1.45-2.32 2.01 1.77-2.29Oppositely coming traffic 2.05 1.56-2.69 2.15 1.64-2.82 2.18 1.88-2.53Motorcycle 0.53 0.38-0.75 0.52 0.37-0.74 0.51 0.43-0.61Rain- High-risk 0.19 0.15-0.24 0.17 0.11-0.27 0.16 0.13-0.20- Low-risk 0.47 0.29-0.78 0.48 0.29-0.79 0.45 0.35-0.58See Appendix 8 for more <strong>de</strong>tails on univariate analysesOR – Odds ratio95% CI – 95% confi<strong>de</strong>nce intervalMo<strong>de</strong>l 1 – Without random effectMo<strong>de</strong>l 2 – Site as random effectMo<strong>de</strong>l 3 – Driver as random effect* Motorcyclists were not analyzed separately, as no differences were observed.55
6. Discussion6.1 Originality of studiesResearch methods <strong>de</strong>scribed here could contribute to the documentation of gaps, impeding<strong>de</strong>velopment and implementation of specific interventions in LMICs [16]. Availability oftraffic exposition from two countries showed an increasingly high road disease bur<strong>de</strong>ncompared to similar roads in HICs, even with police un<strong>de</strong>rreporting documented earlier [9,64]. Broa<strong>de</strong>r implementation of such simple methods, which is not the case at present, couldbe useful to i<strong>de</strong>ntify high-risk road networks in LMICs [128]. Nevertheless, a complementarystudy, that we conducted, comparing the concordance between fatality indicators computedwith difference expositions showed that traffic exposition is not reliably collected in LMICs[129]. Vehicle counts on both road sections were based on surveys and were an approximateestimate of traffic exposition. As road bur<strong>de</strong>n and the impact of interventions to reduce thisbur<strong>de</strong>n could not be accurately analyzed without adjusting for traffic exposition [128],reliability and validity of methods employed to collect this information on interurban roads inLMICs needs to be further assessed [130].Furthermore, we documented involvement of situational factors in RTCs using case controland cohort study methods. Such methods were almost never used for assessing specific roadrisk factors and their attributable risk proportions in LMICs [3, 92]. Similarly, hazardperception study methods were based on methods for assessing the performance of diagnostictests, to show the accuracy of drivers in differentiating high-risk sites from the low-risk ones[125]. This method assessed odds of poor hazard perception of high-risk sites with givencharacteristics compared to low-risk sites with same characteristics [108]. Such a method hastwo benefits; firstly, it i<strong>de</strong>ntified high-risk sites with low hazard perception and secondly, iti<strong>de</strong>ntified those site factors which are perceived less hazardous at high-risk sites than low-riskones. This information could be useful in <strong>de</strong>veloping and implementing specific interventionsfor such settings. These methods can be applicable to un<strong>de</strong>rstand the interactions betweensite- and driver-related factors in HICs and LMICs [49].6.2 Comparison with published literaturePrevious research showed that traffic fatality per population was two to three times higher inLMICs than in HICs [2]. However, comparable traffic safety indicator, fatality per vehiclekm, is rarely available for interurban roads in LMICs. Our results consistently showed thatinterurban traffic fatality and injury per km travelled was dramatically higher on interurbanroads in Cameroon and Pakistan than similar roads in HICs [9]. Traffic fatality was 73 per100 million vehicle-km on the Yaoundé-Douala road section, a rate 35 times higher than for asimilar road in the US (≤ 2 per 100 million vehicle-km). Similarly, traffic fatality was 53 per10 9 km vehicle-km on the Karachi-Hala road section, a rate 13 times higher than a similarroad in France (≤ 4 <strong>de</strong>ath per 10 9 km travelled). Further, an alarming increase in road fatalitywas observed from 2004 to 2006 in Cameroon. These results clearly point out the need toassess comparable and sensitive traffic fatality indicators in LMICs, so that interurban roadbur<strong>de</strong>n can be measured reliably over time [105]. This may help to advocate appropriateresources for road interventions in these countries [50].Both our <strong>de</strong>scriptive studies consistently showed that vehicle occupants accounted for mosttraffic injuries on these road sections. These results were not surprising, as these vehiclesaccount for half of the traffic on these roads [83]. However, when adjusted for km travelled,fatality and severe injury risk was significantly higher for occupants of light vehicles (cars)and buses as compared to trucks’ occupants. Several factors could explain this high mortalityin such road user groups. Speeding was i<strong>de</strong>ntified as one of the major cause of crashes on56
these road sections. Our complementary speed measurements (Appendix 2) and other studiesin the African region clearly showed that the likelihood for over-speeding is higher forsmaller and passenger vehicles [24, 106, 122].Moreover, a high injury severity can be explained by failure to use seat belts in LMICs [131].Previous research has shown that poor law enforcement and old vehicles are two importantfactors limiting the use of seat belts in these countries [131, 132]. In both settings, seat beltuse among the injured was not reported. Further, we observed in our pilot study that only onethirdof the car drivers wore seat belts in Pakistan. Seat-belt wearing is not mandatory for allvehicle occupants in Pakistan [2]. Most commercial buses do not have seat belts for theirdriver and passengers [10]. With higher speeds allowed on interurban road sections, injuryseverity for such occupants can be higher in case of a crash [3]. Thus, there is a need toimprove traffic law and their enforcement on interurban roads in LMICs [2].Our hazard perception study did provi<strong>de</strong> some useful insights with respect to drivers ofsmaller vehicles. Results showed that drivers of these vehicles were not fully aware of roadhazards, as compared to drivers of heavy vehicles. Furthermore, a low seat-belt use and a highcell phone use reflected the low hazard perception observed in those driving such vehicles[133]. This points out the need to improve traffic enforcement as well as the <strong>de</strong>velopment ofhazard perception interventions for drivers of such smaller yet powerful vehicles, for whichtraffic fatality risks are higher [134].Emergency care to the injured remains an important Government priority in LMICs [135].Previous research has clearly shown that essential airway and life-saving equipment wereoften not available in the hospitals around major road network in LMICs [136]. In this thesis,our focus was mostly to assess the pre-event situational factors involved in crashes. However,we noted that transport of the victims and availability of pre-hospital care is rudimentary onboth road sections. In Cameroon, most patients came to hospitals by private means. Similarly,<strong>de</strong>spite the availability ambulance service in Pakistan, still an important proportion of thosewho atten<strong>de</strong>d ED came by their own means. In fact, there was no system of triaging patientsaccording to their severity at site, and <strong>de</strong>cision to shift the patient are either taken bystan<strong>de</strong>rs,the police, or unqualified ambulance personals [137]. Moreover, there was no organizedtrauma care system with <strong>de</strong>signated trauma centres on both road sections, although they arenear major cities in their countries. Improving access to skilled care can <strong>de</strong>crease this highroad bur<strong>de</strong>n outsi<strong>de</strong> urban areas [82]. These results point out the need to assess current traumacare systems along interurban road sections in LMICs, and make policies to use themefficiently to <strong>de</strong>crease this road bur<strong>de</strong>n [138].In Pakistan, police traffic injury records were compared to ambulance and hospital records.To our knowledge, this type of record linking between different datasets for interurban roadinjuries has not been done before in a LMIC [3]. This permitted to measure un<strong>de</strong>r-reporting inpolice records for this road sections. We estimated that police i<strong>de</strong>ntified only one out of fivetraffic fatalities and one of ten severe injuries on this road section. The traffic fatalityun<strong>de</strong>rreporting was high on this interurban road compared to one of two fatalities reported bypolice, estimated in Karachi city [64]. Further, even when ambulance and hospital recordsappeared to have recor<strong>de</strong>d higher traffic injury numbers, both accounted for only half oftraffic fatalities and injuries separately. Most HICs have their specific police based roadtraffic injury surveillance system with a fair coverage of injury crashes on interurban road [9,55]. Without such surveillance system, accurate assessment of road bur<strong>de</strong>n will remain aproblem in LMICs.Moreover, we observed that the United Nations <strong>de</strong>finition for road fatality was notimplemented in police data [3]. Clearly, police did not follow injury patients up to 30 days.57
Although adjustments are possible, overall injury severity of interurban crashes can be higherthan urban crashes [82]. Previous research has shown that an important proportion of roadfatalities occurred on these road sections in Pakistan [63]. These results suggested that cautionshould be taken while interpreting traffic injury outcome for interurban road crashes andvalidity of adjustment mo<strong>de</strong>ls for estimating such traffic fatalities should be assessed inLMICs [139].We noted differential reporting of involved road user groups in police data as compared tohealth data [140]. It was observed that overall proportion of vulnerable road users was half inpolice data compared to health services data. These findings were similar to those observed ina HIC [141]. These results indicated that police reporting needs improvement to avoid suchbias, so that interventions to protect vulnerable road users in interurban road settings inLMICs can be effectively advocated [11].Traffic situation in LMICs is different from HICs because of different traffic mix, poor roadconditions, <strong>de</strong>velopment of built-up areas around interurban roads, and ol<strong>de</strong>r vehicles [11].Involvement of situational factors in crashes on two road sections was less than 5%, whenpolice records were used to assess crash factors [55]. However, confronting police reportedsituational factors with i<strong>de</strong>ntified crash types showed specific patterns. Crashes involvingpe<strong>de</strong>strians and motorcycles for instance, were higher in built-up areas, at intersections, andnear schools as compared to the overall crashes. Moreover, excessive speed was frequentlyobserved in crashes at intersections. Similarly, running-off-the-road crashes were morefrequent on road sections with curve and flat profiles. Certainly, most police reports in bothcountries focused on i<strong>de</strong>ntifying road user error and violations [7]. Information on situationalfactors is rarely interpreted in LMICs. The standardizing of information using a grid can beuseful to assess the involvement of situational factors in crashes in these countries.Moreover, it was observed that there was no system for i<strong>de</strong>ntification of hazardous sites onneither road sections. Safety audits, which are supposed to be part of road projects, asrecommen<strong>de</strong>d by the World Bank and other donor agencies, are often not properlyimplemented in LMICs [17]. There is a strong need to establish close coordination betweenenforcement and road agencies to improve safety data collection and its utilization in LMICs[3, 128, 142]. Such measures may help to envisage site-specific as well as area-wi<strong>de</strong> roadinterventions in these countries [91].Previous research pointed out that built-up areas are over-represented in interurban roadcrashes in LMICs [19]. Likely explanations could be the presence of vulnerable road users,excessive speed, and ina<strong>de</strong>quate indications along these road sections [17, 19, 25]. InCameroon, it was observed that 29% of injury crashes that occurred in built-up areas,involved one or more pe<strong>de</strong>strians, versus only 13% in rural crashes. Similarly, 18% of injurycrashes that occurred in built-up areas involved one or more two-wheeled motor vehicles,versus only 4% in rural crashes. The attributable risk for built-area was high (16.1%), but theintervention consequences of such a result are not straightforward, as those areas cover a largepart of the road section, 35% as estimated from control sites. These results suggest that areawi<strong>de</strong>traffic calming measures in the most populated and plain areas should, however, beconsi<strong>de</strong>red, in particular to protect the most vulnerable road users.Crash sites were also associated with intersections, which can become a hub of commercialactivity with a lot of pe<strong>de</strong>strian movements and traffic conflicts on intercity road sections inLMICs [17]. It should be noted that two-wheeled motor vehicle crashes were overrepresentedat intersections (21% versus 9%), but this was not the case for pe<strong>de</strong>strians (19% versus 21%).These results indicate that service lanes and crossing facilities in built-up environment mighttherefore reduce the risk of crashes on this road [11, 17].58
The hazard perception study showed that sites in built-up areas and intersections had higherhazard perception than those in rural areas. However, the hazard perception of high-risk siteswithin built-up areas was significantly less than sites not involved in crashes situated in suchareas. Speed-reducing measures such as hazard signs, traffic lights, pavement markings, andlane-width modifications were extremely rare in built-up areas on both road sections [143].This implies that improved hazard perception with speed-calming interventions can be usefulin reducing crashes at known high-risk sites [11, 60, 143].In both settings, most crashes occurred on road sections with flat and straight road profile.The case-control study indicated that a flat road profile was associated with injury crashes inCameroon. Here again, no particular crash types were represented at sites with a flat roadprofile. Increased likelihood of crashes on flat and wi<strong>de</strong> road indicated that these results couldbe explained by speed and hazardous overtaking [19, 39, 92]. Similarly, relative flat profilecould explain a high crash rate on the Edéa-Douala road, but this hypothesis could not betested in absence of population <strong>de</strong>nsity and speed measures for this sub-section.The hazard perception study showed some interesting results regarding the above findings.High-risk sites with flat and straight road profile were not perceived as hazardous by drivers.Drivers choose significantly higher speeds for such road sections, compared to sites withslope and curved road profile [24]. Traffic speed monitoring thus in such context becomes thecornerstone for crash prevention [144]. Although NHMP implemented a strict spee<strong>de</strong>nforcement measures on the Pakistani highway in the daylight settings, these measures werenot consistently implemented in Cameroon at present. Nevertheless, available informationpoints out the need to improve speed enforcement in such road situations [3].In Cameroon and Pakistan, a significant proportion of crashes occurred as a result of loss ofcontrol by drivers and vehicles crashed off the road. In<strong>de</strong>ed, overall speed reduction is animportant preventive intervention, but we have observed that in Cameroon the nearbyobstacles (< 4 m) were associated with injury crash sites. These obstacles not only increasethe crash risk by blocking the drivers’ view, but also increase the vulnerability of occupantswhen a crash occurs. Removal of these obstacles should be consi<strong>de</strong>red if feasible, otherwisemeasures such as crash barriers should be prioritized to reduce the risk of injuries [60]. This isall the more interesting as the proportion of such sites is relatively low, 4.2% as estimatedfrom control sites.The hazardous overtaking appeared to be an important cause of severe crashes with nonseparatedtraffic conditions. Almost half of the traffic in both countries is composed of trucksor other slow-moving vehicles [24]. Increased traffic volume could lead to this hazardousovertaking by smaller and faster vehicles, thus increasing traffic conflict and crash risk insuch conditions. Therefore, it becomes imperative to separate the traffic by safety barriers inthe high-risk areas where such crashes are observed in excess numbers [14]. Theseinterventions have reduced the crash bur<strong>de</strong>n and were shown to be cost-effective in Swe<strong>de</strong>n,but their feasibility in LMICs remains to be assessed [14].Highways in LMICs un<strong>de</strong>rgo extensive wear and tear for several reasons. Firstly, overloadingof vehicles is a frequent traffic violation, as observed in Pakistan [81]. Drivers after paying atraffic ticket continue to travel on the road network, thus damaging roads on its way.Secondly, <strong>de</strong>lays in reconstruction and maintenance are frequent because LMICs often havefinancial difficulties [80]. Our results showed that road surface irregularities were associatedwith injury-crash sites. It is possible that these factors increased the likelihood of crashes dueto loss of control, break failures, forced lane change, and abrupt breaking [92, 145]. Further59
observational studies on how the <strong>de</strong>gree of surface irregularity impacts vehicle speed anddirection could be useful to assess crash risk with similar road conditions [11].Mechanical problems, in particular tyre bursts, were i<strong>de</strong>ntified as important causes of fatalcrashes in both settings. Tyre bursts were previously i<strong>de</strong>ntified as an important vehicle factorinvolved in crashes in LMICs [145]. In most LMICs, car owners prefer using used tyres dueto financial constraints [50]. Previous research has clearly shown that these countries do nothave an effective vehicle inspection system [19, 92]. Irregular road surface conditions oninterurban roads may facilitate frequent tyre burst in LMICs [11]. The relative contribution oftyre problems in crashes indicated that realistic inspection system on interurban road sectionsin LMICs, keeping in mind that car owner might not be able to afford the correspondingmaintenance costs [50]. Road surface improvement may help reduce crashes attributed to tyreproblems in these countries.Traffic <strong>de</strong>mands on the road sector and consistently augmenting in LMICs. Highway traffic isexpected to triple in Pakistan over a period from 2005 to 2015 [81]. The reconstruction andupgrading of highways will certainly increase in these countries. The study on HWZ safety inPakistan, for the first time showed a significantly high traffic crash and fatality bur<strong>de</strong>n due tosuch conditions. Gui<strong>de</strong>lines for work zone management exist but so far no mechanism forHWZ <strong>de</strong>sign, performance, and enforcement evaluation has been <strong>de</strong>fined or implemented inPakistan [146]. In<strong>de</strong>ed, there is a need to improve institutional capacity, as well as inspectionmechanisms, so that road agencies could be accountable for ensuring HWZ safety [81, 99,146]. Further, it was observed that lengthy work zones lasted for over 10 months. Thus,efforts are required to reduce HWZ duration to impact crash risks [146].Moreover, one of two HWZ crashes occurred between opposite-direction vehicles; the likelyexplanation was the high volume un-separated traffic conditions and hazardous overtaking.This points out the need to carefully plan and execute the safe flow of traffic duringmaintenance works [147]. Enforcing harsher penalties for overtaking, providing alternatelanes, and traffic separation may be some useful measures to <strong>de</strong>crease hazardous situationsleading to HWZs crashes in Pakistan [146].Our study showed that pe<strong>de</strong>strians were significantly involved in HWZ crashes. Sud<strong>de</strong>n entryonto the highway was reported as the major cause of such crashes. Similarly, wet surfacesincreased the risk of HWZ crashes. Such involvements, although less important, were foundin HWZ crashes elsewhere [100]. Human judgement error is in<strong>de</strong>ed one of the principal factori<strong>de</strong>ntified in HWZ crashes [100, 101]. These results indicated that provision of advancewarning area, clear zones to enhance visibility, road markings, and hazard signage in the workarea can be useful interventions to reduce HWZ crashes in Pakistan [94, 146].Adverse weather conditions were involved in a significant proportion of interurban roadcrashes in Cameroon and Pakistan. We observed that there were no specific speed-restrictionsimposed for such conditions on both road sections. Hazard perception for rainy conditionswas lower for high-risk crash sites compared to low-risk sites. These results point out the needfor measures that would help drivers better i<strong>de</strong>ntify hazards in such conditions at high-risksites. Specific measures, such as all-weather pavement markings, reduced speed limits, andsurface improvements may help reduce such crashes in LMICs [99].The hazard perception study showed that drivers were able to i<strong>de</strong>ntify only half of high-risksites. A reciprocal relationship of road and traffic hazard perception with reported speed wasobserved. The finding that hazard perception of high-risk sites was significantly differentfrom that of low-risk sites for some of the site factors may have implications for road safety.Hazard perception of high-risk crash sites, for instance with hazard signs, was significantly60
higher than that of low-risk sites. It is likely that drivers perceived a high-risk crash site morehazardous when road furniture and hazard signage was available on such site [11, 17].Interurban road maintenance has not received a<strong>de</strong>quate attention in LMICs as shown by fewroad signs observed in Cameroon and Pakistan. These results suggested that <strong>de</strong>velopment andimplementation of interventions improving hazard perception may be useful in reducing thecrash risk on interurban road sections in LMICs [14].Further, we observed that hazard perception was higher for Cameroonian sites as compared toPakistani sites. This could be explained by traffic conditions, separated in Pakistan comparedto non-separated in Cameroon. A higher hazard perception of sites with work zones inPakistan, where traffic was not separated showed a similar trend for higher hazard perception[148, 149]. Further, mountainous terrain, unfamiliarity with the road section, and right-handdriving could augment hazard perception for Cameroonian site vi<strong>de</strong>os [150, 151]. Theseresults showed that hazard perception measures <strong>de</strong>veloped elsewhere should be validatedcross culturally and vi<strong>de</strong>o methods can be useful to conduct such studies.7. Limitations and perspectivesIn line with the increasing crash bur<strong>de</strong>n in LMIC, the United Nations has <strong>de</strong>clared the next<strong>de</strong>ca<strong>de</strong> as the “Deca<strong>de</strong> of Action for Road Safety 2011-2020” [3]. Such actions should bemonitored with valid and reliable indicators. The police data that we used in Cameroon mighthave two limitations for estimating traffic fatality. Firstly, all police reports were not collectedand secondly, reported injured patients were followed at most for eight days. This leads toun<strong>de</strong>restimation of our rates, which could not be corrected in the analyses [3]. Although wewere able to record all police reported injuries on the Pakistani road section, we observed thatpolice recording of traffic fatalities and injuries was very low when compared to ambulanceor ED data [64]. The record linkage helped to estimate overall injury rates but failed toi<strong>de</strong>ntify high-risk crash sites or other information that could be useful for implementingpreventive interventions [152]. Furthermore, information on safety equipment use by vehicleoccupants and motorcycle ri<strong>de</strong>r was almost never reported in police data. All this showed thatthere is a need to improve the existing interurban road injury surveillance system so that wecould measure the impact of safety interventions in the future. The police should be provi<strong>de</strong>dwith a<strong>de</strong>quate resources and training to collect information as is the case in HICs [55].Preliminary results from this thesis were communicated to the NHMP and a complementarystudy is currently un<strong>de</strong>rgoing to evaluate the impact of strict seat-belt law implementation atKarachi-Hala road section. We hope to work with them in the future on my return to Pakistan,so that we can plan other studies to better un<strong>de</strong>rstand which factors impe<strong>de</strong> safety equipmentuse and are responsible for the high fatality among passenger occupants.Associations of situational factors with injury crash sites did not imply a causal relationship.As road <strong>de</strong>sign and furniture improvements are planned on Yaoundé-Douala road section, wewould like to reassess the road bur<strong>de</strong>n on the same road section in coming years. Few studieshave reported the effectiveness of road interventions in LMICs [90], and such data collectionin Cameroon and possibly on other interurban roads in Pakistan will help measure the impactof interventions, particularly with respect to specific situational factors.In the studies <strong>de</strong>scribed here, most injury patients came to the hospital on their own, on bothroad sections. In Pakistan, slightly higher proportion of the patients was transported by theambulance service. In connection with the field work in Pakistan, a study was conducted toassess the quality of pre-hospital care available to RTI patients on interurban roads in theprovince of Sindh. Trauma care quality has rarely been assessed in LMICs [2, 3]. Ourevaluation of trauma care in a Moroccan region i<strong>de</strong>ntified several opportunities forimprovement in the current healthcare system [153]. Results from such a study can be useful61
to un<strong>de</strong>rstand the <strong>de</strong>ficiencies in the trauma care system as well as propose recommendationsto the stake hol<strong>de</strong>rs of road safety.Finally, results from the hazard perception study indicated a significant interaction betweendriver- and site-related factors at high-risk sites. Up to now, methods to prioritize high-risksite improvement concentrated on crash data, whereas driver perception of site was neverstudied in this regard. These results encourage pilot testing of projects for integrating thesemethods in prioritizing crash sites for improvement. Further, because of limited resources atthe time of study initiation, we were not able to construct a portable simulator to measure thedriver reactions such as vi<strong>de</strong>o speed selection or <strong>de</strong>viation of steering wheel upon perceivinga hazard while vi<strong>de</strong>o projection. Such a method could further validate our hypothesis and helpin un<strong>de</strong>rstanding more the above interactions. I would like to continue working on this topicand consi<strong>de</strong>r conducting such program in a LMIC to help in <strong>de</strong>velopment and implementationof cost-effective preventive measures in such settings.8. ConclusionThe studies conducted here clearly <strong>de</strong>monstrate the need to reduce the crash bur<strong>de</strong>n oninterurban road sections in LMICs. Several lessons can be learnt from these studies: Firstly, areliable and accurate injury surveillance system is required to assess the highway injurybur<strong>de</strong>n in LMICs. Police reporting has been efficiently used in HICs to assess road bur<strong>de</strong>nand there is no reason that this cannot be achieved in LMICs, with improved resources andmechanism. Further, efforts are required to improve vulnerable road users reporting incrashes. Exposition measures should be used to compute comparable and sensitive trafficsafety indicators in these countries.Secondly, there is a need to improve coordination between road and police authorities toproperly use the information on crash site location and situational factors for preventionpurposes by the stake hol<strong>de</strong>rs. Our results indicate that traffic calming and speed enforcementinterventions in built-up areas and on flat sections of the road should be prioritized. Moreover,road surface maintenance and the removal of nearby roadsi<strong>de</strong> obstacles are likely to preventmany serious crashes.Thirdly, HWZ activity is expected to increase in Pakistan and other LMICs. The resultssuggest that a monitoring system is nee<strong>de</strong>d to examine the HWZ safety interventions byagencies involved in maintenance works. Moreover, efforts are required to reduce theduration of HWZs. These results orient toward prevention interventions such as harsherpunishment for traffic violations such as overtaking, traffic separation, advanced warningarea, hazard signage, and safe passages for pe<strong>de</strong>strians at HWZs in Pakistan. Feasibility an<strong>de</strong>ffectiveness of their implementation, however remains to be evaluated.Fourthly, the difference in hazard perception of high-risk sites as compared to low-risk siteswith same site factors suggested the need to make roads “self explaining” in LMICs. Hazardperception interventions are mostly of low cost and easy to implement compared to <strong>de</strong>signchanges. These results point out that implementing such interventions may reduce trafficspeed at high-risk sites [154]. Moreover, the study methods can be useful for the roadauthorities to assess the impact of these interventions on drivers’ hazard perception beforetheir implementation [155].Lastly, the focus of this thesis was to document contribution of situational factors ininterurban road crashes. This should not hin<strong>de</strong>r implementing interventions to counter otherinterurban road risk factors such as mechanical failure, tyre problems, speeding, DWI, andlow seatbelt and helmet use.62
References[1] Mohan D. Road traffic injuries--a neglected pan<strong>de</strong>mic. Bull World Health Organ.2003;81(9):684-5.[2] World Health Organization. Global status report on road safety. Geneva: World HealthOrganization; 2009.[3] Pe<strong>de</strong>n M, Scurfiled R, Sleet D, Mohan D, Hy<strong>de</strong>r A, Jarawan E. World report on roadtraffic injury prevention. Geneva: World Health Organization; 2004.[4] Jacobs G, Aeron-Thomas A, Astrop A. Estimating global road fatalities. Crowthorne(UK): Transport Research Laboratory; 2000. Report No.: TRL Report No. 445.[5] Kopits E, Cropper M. Traffic fatalities and economic growth. Accid Anal Prev. 2005Jan;37(1):169-78.[6] International Road Fe<strong>de</strong>ration. World Road Statistics 2008 (Data 2001 to 2006).Geneva: International Road Fe<strong>de</strong>ration; 2008.[7] Wootton J, Jacobs GD. Safe roads: A dream or a reality. Crowthorne (UK): TransportResearch Laboratory; 1996. Report No.: PA 3184/96.[8] Khayesi M, Pe<strong>de</strong>n M. Road safety in Africa. BMJ. 2005 Oct 1;331(7519):710-1.[9] Observatoire National Interministériel <strong>de</strong> Sécurité Routière. La sécurité routière enFrance: Bilan <strong>de</strong> l'année 2004. Paris: La documentation Française; 2005.[10] Nishtar S, Mohamud KB, Razzak J, Ghaffar A, Ahmed A, Khan SA, et al. Injuryprevention and control: National Action Plan for NCD Prevention, Control and HealthPromotion in Pakistan. J Pak Med Assoc. 2004 Dec;54(12 Suppl 3):S57-68.[11] Ross A, Baguely C, Hills B, McDonald M, Silcock D. Towards safer roads in<strong>de</strong>veloping countries—a gui<strong>de</strong> for planners and engineers. Crowthorne (UK): TransportResearch Laboratory; 1991.[12] Thomson H, Jepson R, Hurley F, Douglas M. Assessing the uninten<strong>de</strong>d health impactsof road transport policies and interventions: translating research evi<strong>de</strong>nce for use in policyand practice. BMC Public Health. 2008;8:339.[13] Forjuoh SN, Li G. A review of successful transport and home injury interventions togui<strong>de</strong> <strong>de</strong>veloping countries. Soc Sci Med. 1996 Dec;43(11):1551-60.[14] Elvik R, Kolbenstvedt M, Elvebakk B, Hervik A, Braein L. Costs and benefits toSwe<strong>de</strong>n of Swedish road safety research. Accid Anal Prev. 2009 May;41(3):387-92.[15] Borse NN, Hy<strong>de</strong>r AA. Call for more research on injury from the <strong>de</strong>veloping world:results of a bibliometric analysis. Indian J Med Res. 2009 Mar;129(3):321-6.[16] Jamison DT, Mosley WH, Measham AB, Bobadilla JL, eds. Disease Control Prioritiesin Developing Countries. Washington, DC: Oxford University Press; 1993.[17] Mohan D. Road safety in less-motorized environments: future concerns. Int JEpi<strong>de</strong>miol. 2002 Jun;31(3):527-32.[18] Abbas KA. Traffic safety assessment and <strong>de</strong>velopment of predictive mo<strong>de</strong>ls foracci<strong>de</strong>nts on rural roads in Egypt. Accid Anal Prev. 2004 Mar;36(2):149-63.[19] Afukaar FK. Speed control in <strong>de</strong>veloping countries: issues, challenges andopportunities in reducing road traffic injuries. Inj Control Saf Promot. 2003 Mar-Jun;10(1-2):77-81.[20] Akgungor AP, Yildiz O. Sensitivity analysis of an acci<strong>de</strong>nt prediction mo<strong>de</strong>l by thefractional factorial method. Accid Anal Prev. 2007 Jan;39(1):63-8.[21] Almeida LV, Pignatti MG, Espinosa MM. [Main factors associated with motor vehicleacci<strong>de</strong>nts on Fe<strong>de</strong>ral Highway 163, Mato Grosso State, Brazil, 2004]. Cad Sau<strong>de</strong> Publica.2009 Feb;25(2):303-12.[22] Bagaria V, Bagaria S. A geographic information system to study trauma epi<strong>de</strong>miologyin India. J Trauma Manag Outcomes. 2007;1(1):3.[23] Bishai D, Asiimwe B, Abbas S, Hy<strong>de</strong>r AA, Bazeyo W. Cost-effectiveness of trafficenforcement: case study from Uganda. Inj Prev. 2008 Aug;14(4):223-7.63
[24] Damsere-Derry J, Afukaar FK, Donkor P, Mock C. Assessment of vehicle speeds ondifferent categories of roadways in Ghana. Int J Inj Contr Saf Promot. 2008 Jun;15(2):83-91.[25] Derry JD, Afukaar FK, Donkor P, Mock C. Study of vehicle speeds on a majorhighway in Ghana: implication for monitoring and control. Traffic Inj Prev. 2007Jun;8(2):142-6.[26] Duric P, Miladinov-Mikov M. [Epi<strong>de</strong>miological characteristics of road traffic injuriesin AP Vojvodina]. Med Pregl. 2009 Jan-Feb;62(1-2):17-22.[27] Ehikhamenor EE, Obianwuho HO. Digital screening for Blood Alcohol Concentration(BAC) in a Southern Nigeria City. Traffic Inj Prev. 2006 Mar;7(1):70-5.[28] Erdogan S, Yilmaz I, Baybura T, Gullu M. Geographical information systems ai<strong>de</strong>dtraffic acci<strong>de</strong>nt analysis system case study: city of Afyonkarahisar. Accid Anal Prev. 2008Jan;40(1):174-81.[29] Guanche Garcell H, Suarez Enriquez T, Gutierrez Garcia F, Martinez Quesada C,Mendoza Perez R. [Drunk driving in professional drivers in the Via Blanca highway in Cuba].Gac Sanit. 2006 Sep-Oct;20(5):407-9.[30] Hijar M, Carrillo C, Flores M, Anaya R, Lopez V. Risk factors in highway trafficacci<strong>de</strong>nts: a case control study. Accid Anal Prev. 2000 Sep;32(5):703-9.[31] Hijar M, Flores M, Lopez MV, Rosovsky H. Alcohol intake and severity of injuries onhighways in Mexico: a comparative analysis. Addiction. 1998 Oct;93(10):1543-51.[32] Hijar-Medina MC, Carrillo-Ordaz CE, Flores-Aldana ME, Anaya R, Lopez-LopezMV. [Risk factors for injuries caused by traffic acci<strong>de</strong>nts and the impact of an intervention onthe road]. Rev Sau<strong>de</strong> Publica. 1999 Oct;33(5):505-12.[33] Hijar-Medina MC, Flores-Aldana ME, Lopez-Lopez MV. [Safety belt use and severityof injuries in traffic acci<strong>de</strong>nts]. Salud Publica Mex. 1996 Mar-Apr;38(2):118-27.[34] Liu GF, Han S, Liang DH, Wang FZ, Shi XZ, Yu J, et al. Driver sleepiness and risk ofcar crashes in Shenyang, a Chinese northeastern city: population-based case-control study.Biomed Environ Sci. 2003 Sep;16(3):219-26.[35] Loo BP. Validating crash locations for quantitative spatial analysis: a GIS-basedapproach. Accid Anal Prev. 2006 Sep;38(5):879-86.[36] Majdza<strong>de</strong>h R, Khalagi K, Naraghi K, Motevalian A, Eshraghian MR. Determinants oftraffic injuries in drivers and motorcyclists involved in an acci<strong>de</strong>nt. Accid Anal Prev. 2008Jan;40(1):17-23.[37] Mutto M, Kobusingye OC, Lett RR. The effect of an overpass on pe<strong>de</strong>strian injurieson a major highway in Kampala - Uganda. Afr Health Sci. 2002 Dec;2(3):89-93.[38] Nascimento EC, Nascimento E, Silva J<strong>de</strong> P. [Alcohol and amphetamines use amonglong-distance truck drivers.]. Rev Sau<strong>de</strong> Publica. 2007 Apr;41(2):290-3.[39] O<strong>de</strong>ro W, Khayesi M, Heda PM. Road traffic injuries in Kenya: magnitu<strong>de</strong>, causesand status of intervention. Inj Control Saf Promot. 2003 Mar-Jun;10(1-2):53-61.[40] Poli <strong>de</strong> Figueiredo LF, Rasslan S, Bruscagin V, Cruz R, Rocha e Silva M. Increases infines and driver licence withdrawal have effectively reduced immediate <strong>de</strong>aths from traumaon Brazilian roads: first-year report on the new traffic co<strong>de</strong>. Injury. 2001 Mar;32(2):91-4.[41] Rey <strong>de</strong> Castro J, Gallo J, Loureiro H. [Tiredness and sleepiness in bus drivers and roadacci<strong>de</strong>nts in Peru: a quantitative study]. Rev Panam Salud Publica. 2004 Jul;16(1):11-8.[42] Routley V, Ozanne-Smith J, Li D, Yu M, Wang J, Zhang J, et al. China belting up ordown? Seat belt wearing trends in Nanjing and Zhoushan. Accid Anal Prev. 2008Nov;40(6):1850-8.[43] Saidi HS, Kahoro P. Experience with road traffic acci<strong>de</strong>nt victims at The NairobiHospital. East Afr Med J. 2001 Aug;78(8):441-4.[44] Souza JC, Paiva T, Reimao R. Sleep habits, sleepiness and acci<strong>de</strong>nts among truckdrivers. Arq Neuropsiquiatr. 2005 Dec;63(4):925-30.[45] van Schoor O, van Niekerk JL, Grobbelaar B. Mechanical failures as a contributingcause to motor vehicle acci<strong>de</strong>nts South Africa. Accid Anal Prev. 2001 Nov;33(6):713-21.64
[46] Viegas CA, <strong>de</strong> Oliveira HW. Prevalence of risk factors for obstructive sleep apneasyndrome in interstate bus drivers. J Bras Pneumol. 2006 Mar-Apr;32(2):144-9.[47] Yildirim RC. Caffeine consumption in drivers of heavy vehicles in Turkey. PublicHealth. 2003 Sep;117(5):329-32.[48] Zhou JH, Zhao XC, Jiang ZQ, Zhu SY, Zhou JC. Investigation on road traffic safety ofthe mountain areas in southwest China based on Wulong County, Chongqing Municipality.Traffic Inj Prev. 2005 Jun;6(2):193-6.[49] Sabey BE, Taylor H. The Known Risks We Run: The Highway. In: Schwing SC,Alber WA, eds. Societal Risk Assessment: How safe is safe enough. New York: PlenumPress; 1980.[50] Lagar<strong>de</strong> E. Road traffic injury is an escalating bur<strong>de</strong>n in Africa and <strong>de</strong>servesproportionate research efforts. PLoS Med. 2007 Jun;4(6):e170.[51] Mock C, Cherian MN. The global bur<strong>de</strong>n of musculoskeletal injuries: challenges andsolutions. Clin Orthop Relat Res. 2008 Oct;466(10):2306-16.[52] Gururaj G. Road traffic <strong>de</strong>aths, injuries and disabilities in India: current scenario. NatlMed J India. 2008 Jan-Feb;21(1):14-20.[53] Mathers C, Boerma T, Ma Fat D. The global bur<strong>de</strong>n of disease: 2004 update. Geneva:World Health Organization; 2008.[54] Nantulya VM, Reich MR. Equity dimensions of road traffic injuries in low- andmiddle-income countries. Inj Control Saf Promot. 2003 Mar-Jun;10(1-2):13-20.[55] Evans L. Traffic Safety. Bloomfield Hills, MI: Science Serving Society; 2004.[56] Runyan CW. Introduction: back to the future--revisiting Haddon's conceptualization ofinjury epi<strong>de</strong>miology and prevention. Epi<strong>de</strong>miol Rev. 2003;25:60-4.[57] Runyan CW. Using the Haddon matrix: introducing the third dimension. Inj Prev.1998 Dec;4(4):302-7.[58] NSW Roads and Traffic Authority. Why speeding? Regret is such a short distance.Sydney: NSW Roads and Traffic Authority; 1996.[59] Subramanian R. Geospatial Analysis of Rural Motor Vehicle Traffic Fatalities.Washington, DC: National Highway Traffic Safety Administration; 2009.[60] Oxley J, Corben B, Koppel S, Fil<strong>de</strong>s B, Jacques N, Symmons M, et al. Cost-effectiveinfrastructure measures on rural roads. Clayton, Victoria: Monash University Acci<strong>de</strong>ntResearch Centre; 2004.[61] Petridou E, Moustaki M. Human factors in the causation of road traffic crashes. Eur JEpi<strong>de</strong>miol. 2000;16(9):819-26.[62] Crane EO, Augustine A, Tait GR. The M77 Highway: saving lives and money. Injury.2008 Sep;39(9):1071-4.[63] National Transport Research Centre. Traffic Counter measures in Pakistan. Islamabad:National Transport Research Centre, Ministry of Communication; 1985. Report No.: NTRCpublication 85.[64] Razzak JA, Luby SP. Estimating <strong>de</strong>aths and injuries due to road traffic acci<strong>de</strong>nts inKarachi, Pakistan, through the capture-recapture method. Int J Epi<strong>de</strong>miol. 1998Oct;27(5):866-70.[65] Zavareh DK, Mohammadi R, Laflamme L, Naghavi M, Zarei A, Haglund BJ.Estimating road traffic mortality more accurately: use of the capture-recapture method in theWest Azarbaijan province of Iran. Int J Inj Contr Saf Promot. 2008 Mar;15(1):9-17.[66] Andra<strong>de</strong> SM, Prado <strong>de</strong> Mello-Jorge MH. [Traffic acci<strong>de</strong>nts in a city in SouthernBrazil: an evaluation of coverage and quality of data]. Cad Sau<strong>de</strong> Publica. 2001 Nov-Dec;17(6):1449-56.[67] Perel P, Ker K, Ivers R, Blackhall K. Road safety in low- and middle-incomecountries: a neglected research area. Inj Prev. 2007 Aug;13(4):227.[68] Perel P, McGuire M, Eapen K, Ferraro A. Research on preventing road traffic injuriesin <strong>de</strong>veloping countries is nee<strong>de</strong>d. BMJ. 2004 Apr 10;328(7444):895.65
[69] Central Intelligence Agency. The World Factbook. Langley, VA: Directorate ofIntelligence; 2009.[70] Regional Department Centre (ORCE). Country Strategy Paper 2010-2014, Cameroon.Tunis-Belvedère: African Development Fund, African Development Bank; 2009.[71] Ze Minkan<strong>de</strong> J, Simo Moyo J, Afane Ela A, Penlap Temdie E, Nnomoko Bilounga E,Beyiha G, et al. Bilan <strong>de</strong>s trois premières années d'activités du SAMU <strong>de</strong> Yaoundé(Cameroun). Med Trop (Mars). 2009;69(6):577-80.[72] Jane and Justice. Les acci<strong>de</strong>nts <strong>de</strong> la circulation au Cameroun <strong>de</strong> 1982 <strong>à</strong> 2001.Yaoundé: Jane and Justice; 2003.[73] Ministère <strong>de</strong>s Travaux Publiques. Comptages routiers 2005 : Syn<strong>thèse</strong> <strong>de</strong>s campagnes<strong>de</strong> mai et novembre. Yaoundé: Direction <strong>de</strong>s investissements et <strong>de</strong> l’entretien routier, Cellule<strong>de</strong> la programmation, Ministère <strong>de</strong>s Travaux Publiques; 2006.[74] Epi Info [Computer program]. Version 3.5.1. Atlanta, GA: Centers for Disease Controland Prevention; 2008.[75] SAS [Computer program]. Version 9.1.3. Cary, NC: SAS Institute Inc.; 2004.[76] National Transport Research Centre. Manual of road safety improvement by the use oflow cost engineering countermeasures. Islamabad: National Transport Research Centre,National Highway Authority, and Finnroad OY; 1999.[77] Ghaffar A, Hy<strong>de</strong>r AA, Masud TI. The bur<strong>de</strong>n of road traffic injuries in <strong>de</strong>velopingcountries: the 1 st national injury survey of Pakistan. Public Health. 2004 Apr;118(3):211-7.[78] Fatmi Z, Had<strong>de</strong>n WC, Razzak JA, Qureshi HI, Hy<strong>de</strong>r AA, Pappas G. Inci<strong>de</strong>nce,patterns and severity of reported unintentional injuries in Pakistan for persons five years andol<strong>de</strong>r: results of the National Health Survey of Pakistan 1990-94. BMC Public Health.2007;7:152.[79] Raja IA, Vohra AH, Ahmed M. Neurotrauma in Pakistan. World J Surg. 2001Sep;25(9):1230-7.[80] Ahmed A. Road Safety in Pakistan. Islamabad: National Road Safety Secretariat;2007.[81] Japan International Cooperation Agency, National Transport Research Centre,Government of Pakistan. Pakistan Transport Plan Study in the Islamic Republic Of Pakistan.Islamabad: tripartite collaboration of the Japan International Cooperation Agency, NationalTransport Research Centre, and Ministry of Communications, Government of Pakistan; 2007.[82] Shah SG, Khoumbati K, Soomro B. The pattern of <strong>de</strong>aths in road traffic crashes inSindh, Pakistan. Int J Inj Contr Saf Promot. 2007 Dec;14(4):231-9.[83] National Highway Authority. Traffic survey. Islamabad: National Highway Authority;2008.[84] Government of Pakistan. Pakistan Economic Survey 2008-09. Islamabad: EconomicAdvisor's Wing, Finance Division, Government of Pakistan; 2009.[85] Khoso A. Analysis of National Highways & Motorway Police injury surveillancesystem with respect to WHO injury surveillance gui<strong>de</strong>lines. Stockholm: Karolinska Institutet;2007.[86] Razzak JA, Luby SP, Laflamme L, Chotani H. Injuries among children in Karachi,Pakistan--what, where and how. Public Health. 2004 Mar;118(2):114-20.[87] Road Injury Research and Prevention Centre. Report of road injury surveillanceproject of the road injury research and prevention centre of JPMC, Karachi. Karachi: JinnahPost Graduate Medical Centre (JPMC); 2008.[88] Stevenson M, Segui-Gomez M, Lescohier I, Di Scala C, McDonald-Smith G. Anoverview of the injury severity score and the new injury severity score. Inj Prev. 2001Mar;7(1):10-3.[89] National Highway and Motorway Police. Acci<strong>de</strong>nt Analysis Report N5 (Year 2006).Islamabad: National Highway and Motorway Police; 2007.66
[90] O<strong>de</strong>ro W, Garner P, Zwi A. Road traffic injuries in <strong>de</strong>veloping countries: acomprehensive review of epi<strong>de</strong>miological studies. Trop Med Int Health. 1997 May;2(5):445-60.[91] Morency P, Cloutier MS. From targeted "black spots" to area-wi<strong>de</strong> pe<strong>de</strong>strian safety.Inj Prev. 2006 Dec;12(6):360-4.[92] Nordberg E. Injuries as a public health problem in sub-Saharan Africa: epi<strong>de</strong>miologyand prospects for control. East Afr Med J. 2000 Dec;77(12 Suppl):S1-43.[93] Rockhill B, Newman B, Weinberg C. Use and misuse of population attributablefractions. Am J Public Health. 1998 Jan;88(1):15-9.[94] Li Y, Bai Y. Development of crash-severity-in<strong>de</strong>x mo<strong>de</strong>ls for the measurement ofwork zone risk levels. Accid Anal Prev. 2008 Sep;40(5):1724-31.[95] Department of Transportation. Highway Statistics 2007: Funding For Highways andDisposition of Highway-User Revenues. Washington, DC: Department of Transportation;2007.[96] Department of Transportation. FY 2008 Budget in brief. Washington, DC: Departmentof Transportation; 2008.[97] Republic of Ghana, European Community. Country Strategy Paper and IndicativeProgramme for the period 2002–2007 Accra: European Union <strong>de</strong>legation in Ghana; 2002.Report No.: DEV/054/2002-EN.[98] Masood H, Seetharam KC, Utami D, Nakazaki T, Ahmad K, Beg B. Report andrecommendation of the Presi<strong>de</strong>nt to the board of directors on proposed loans to the IslamicRepublic of Pakistan for the North-West Frontier Province road <strong>de</strong>velopment sector andsubregional connectivity project. Manila: Asian Development Bank; 2004. Report No.: RRP:PAK 36052.[99] American Association of State Highway and Transportation Officials. A policy ongeometric <strong>de</strong>sign of highways and streets. Washington, DC: American Association of StateHighway and Transportation Officials; 2004.[100] Li Y, Bai Y. Comparison of characteristics between fatal and injury acci<strong>de</strong>nts inhighway work zones. Safety Sci. 2008;46(4):646-60.[101] Li Y, Bai Y. Highway work zone factors and their impact on crash severity. J TranspEng. 2009;135(10):694-701.[102] Mohan SB, Gautam P. Cost of highway work zone injuries. Practical Periodical onStructural Design and Construction. 2002;7(ASCE (2)):68-73.[103] Department of Transportation. Manual of Uniform Traffic Control Devices for Streetsand Highways Washington, DC: United States Department of Transportation, Fe<strong>de</strong>ralHighway Administration; 1988.[104] Salmi LR, Battista RN. Epi<strong>de</strong>miologic assessment of hazardous roadway locations.Epi<strong>de</strong>miology. 1990 Jul;1(4):311-4.[105] Lassarre S. Some Statistical Mo<strong>de</strong>ls for Road Risk Analysis. In: Tiwari G, Mohan D,Muhlrad N, eds. The Way Forward: Transportation Planning and Road Safety. New Delhi:MacMillan India Ltd.; 2005.[106] Sobngwi-Tambekou J, Bhatti J, Kounga G, Salmi L-R, Lagar<strong>de</strong> E. Road trafficcrashes on the Yaoundé–Douala road section, Cameroon. Accid Anal Prev. 2010;42(2):422-6.[107] Rothman KJ, Greenland S, eds. Mo<strong>de</strong>rn Epi<strong>de</strong>miology. Second ed. Phila<strong>de</strong>lphia, PA:Lippincott Williams & Wilkins; 1998.[108] Hosmer DW, Lemeshow S. Applied Logistic Regression. Second ed. Danvers, MA:John Wiley & Sons, Inc.; 2000.[109] Geurts K, Wets G. Black Spot Analysis Methods: Literature Review. Diepenbeek:Steunpunt Verkeersveiligheid Bij Stijgen<strong>de</strong> Mobiliteit.; 2003. Report No.: RA-2003-07.[110] Elvik R. A survey of operational <strong>de</strong>finitions of hazardous road locations in someEuropean countries. Accid Anal Prev. 2008 Nov;40(6):1830-5.67
[111] Geurts K, Wets G, Brijs T, Vanhoof K, Karlis D. Ranking and selecting dangerouscrash locations: correcting for the number of passengers and Bayesian ranking plots. J SafetyRes. 2006;37(1):83-91.[112] Benda HV, Hoyos CG. Estimating hazards in traffic situations. Accid Anal Prev.1983;15(1):1-9.[113] SWOV. SWOV fact sheet: hazard perception. Leidschendam: SWOV Institute forRoad Safety Research; 2008.[114] DeJoy DM. The optimism bias and traffic acci<strong>de</strong>nt risk perception. Accid Anal Prev.1989 Aug;21(4):333-40.[115] Finn P, Bragg BW. Perception of the risk of an acci<strong>de</strong>nt by young and ol<strong>de</strong>r drivers.Accid Anal Prev. 1986 Aug;18(4):289-98.[116] Harre N. Risk evaluation, driving, and adolescents: a typology. Dev Rev.2000;20:206-26.[117] Mayhew DR, Simpson HM, Pak A. Changes in collision rates among novice driversduring the first months of driving. Accid Anal Prev. 2003;35(683-91).[118] McKenna FP, Stanier RA, Lewis C. Factors un<strong>de</strong>rlying illusory self-assessment ofdriving skill in males and females. Accid Anal Prev. 1991;23:45-52.[119] Trankle U, Gelau C, Metker T. Risk perception and age-specific acci<strong>de</strong>nts of youngdrivers. Accid Anal Prev. 1990 Apr;22(2):119-25.[120] Gol<strong>de</strong>nbeld C, van Schagen I. The credibility of speed limits on 80 km/h rural roads:The effects of road and person(ality) characteristics. Accid Anal Prev. 2007 Nov;39(6):1121-30.[121] Kanellaidis G, Zervas A, Karagioules V. Drivers' risk perception of road <strong>de</strong>signelements. Transp Hum Factors. 2000;2(1):39-48.[122] Deery HA. Hazard and risk perception among young novice drivers. J Safety Res.1999;30(4):225-36.[123] Rundmo T, Iversen H. Risk perception and driving behaviour among adolescents intwo Norwegian counties before and after a traffic safety campaign. Safety Sci. 2004;42(1):1-21.[124] Montella A. A comparative analysis of hotspot i<strong>de</strong>ntification methods. Accid AnalPrev. 2010;42(2):571-81.[125] Flahault A, Cadilhac M, Thomas G. Sample size calculation should be performed for<strong>de</strong>sign accuracy in diagnostic test studies. J Clin Epi<strong>de</strong>miol. 2005 Aug;58(8):859-62.[126] Bhatti JA, Sobngwi-Tambekou J, Lagar<strong>de</strong> E, Salmi LR. Situational factors associatedwith road traffic crashes: A case-control study on the Yaoundé-Douala road section,Cameroon. Int J Inj Contr Saf Promot. 2010 Mar 30:1-8.[127] Sümer N, Ünal AB, Birdal A, Çinar P, Çevikoglu S. Comparison of self-reported andcomputer-based hazard perception skills among novice and experienced drivers. In: FourthInternational Driving Symposium on Human Factors in Driver Assessment, Training andVehicle Design, 2007, 9-12 July, Stevenson, WA. Washington, DC: Transport ResearchBoard; 2007.[128] Tiwari G, Mohan D, Muhlrad N, eds. The Way Forward: Transportation Planning andRoad Safety. Delhi: McMillan India Ltd; 2005.[129] Bhatti JA, Salmi LR, Lagar<strong>de</strong> E, Razzak JA. Concordance between road mortalityindicators in high-income and low- and middle-income countries. Traffic Inj Prev.Apr;11(2):173-7.[130] Sauerzapf V, Jones AP, Haynes R. The problems in <strong>de</strong>termining international roadmortality. Accid Anal Prev. 2010;42(2):492-9.[131] Iribhogbe PE, Osime CO. Compliance with seat belt use in Benin City, Nigeria.Prehosp Disaster Med. 2008 Jan-Feb;23(1):16-9.[132] Sangowawa AO, Alagh BT, Ekanem SE, Ebong IP, Faseru B, A<strong>de</strong>kunle BJ, et al. Anobservational study of seatbelt use among vehicle occupants in Nigeria. Inj Prev. 2010Apr;16(2):85-9.68
[133] Perneger T, Smith GS. The driver's role in fatal two-car crashes: a paired "casecontrol"study. Am J Epi<strong>de</strong>miol. 1991 Nov 15;134(10):1138-45.[134] Bener A, Ghaffar A, Azab A, Sankaran-Kutty M, Toth F, Lovasz G. The impact offour-wheel drives on traffic disability and <strong>de</strong>aths compared to passenger cars. J CollPhysicians Surg Pak. 2006 Apr;16(4):257-60.[135] Jooma R, Khan SJ, Razzak JA. The Trauma Centre: what it should mean. J Pak MedAssoc. 2008 Oct;58(10):530-1.[136] Quansah R. Availability of emergency medical services along major highways. GhanaMed J. 2001;35:8-10.[137] Razzak JA, Cone DC, Rehmani R. Emergency medical services and cultural<strong>de</strong>terminants of an emergency in Karachi, Pakistan. Prehosp Emerg Care. 2001 Jul-Sep;5(3):312-6.[138] Razzak JA, Kellermann AL. Emergency medical care in <strong>de</strong>veloping countries: is itworthwhile? Bull World Health Organ. 2002;80(11):900-5.[139] Bhalla K, Ezzati M, Mahal A, Salomon J, Reich M. A risk-based method for mo<strong>de</strong>lingtraffic fatalities. Risk Anal. 2007 Feb;27(1):125-36.[140] Jarvis SN, Lowe PJ, Avery A, Levene S, Cormack RM. Children are not goldfish--mark/recapture techniques and their application to injury data. Inj Prev. 2000 Mar;6(1):46-50.[141] Dhillon PK, Lightstone AS, Peek-Asa C, Kraus JF. Assessment of hospital and policeascertainment of automobile versus childhood pe<strong>de</strong>strian and bicyclist collisions. Accid AnalPrev. 2001 Jul;33(4):529-37.[142] Khorasani-Zavareh D, Khankeh HR, Mohammadi R, Laflamme L, Bikmoradi A,Haglund BJ. Post-crash management of road traffic injury victims in Iran. Stakehol<strong>de</strong>rs' viewson current barriers and potential facilitators. BMC Emerg Med. 2009;9:8.[143] Retting RA, Ferguson SA, McCartt AT. A review of evi<strong>de</strong>nce-based trafficengineering measures <strong>de</strong>signed to reduce pe<strong>de</strong>strian-motor vehicle crashes. Am J PublicHealth. 2003 Sep;93(9):1456-63.[144] Retting RA, Kyrychenko SY, McCartt AT. Evaluation of automated spee<strong>de</strong>nforcement on Loop 101 freeway in Scottsdale, Arizona. Accid Anal Prev. 2008Jul;40(4):1506-12.[145] Nzegwu MA, Nzegwu CO. Review of causes of road traffic acci<strong>de</strong>nts in Benin City,Nigeria: a 1-year study, August 2003-July 2004. Emerg Med Australas. 2007 Feb;19(1):77-8.[146] Ahmed A. National Road Safety Plan 2007-2012. Islamabad: National Road SafetySecretariat, Ministry of Communications; 2007.[147] American Association of State Highway and Transportation Officials. Summary reporton work zone crashes. Standing committee on highway traffic safety. Washington, DC:American Association of State Highway and Transportation Officials; 1987.[148] Lewis-Evans B, Charlton SG. Explicit and implicit processes in behaviouraladaptation to road width. Accid Anal Prev. 2006 May;38(3):610-7.[149] Morgan JF, Duley AR, Hancock PA. Driver responses to differing urban work zoneconfigurations. Accid Anal Prev. 2010 May;42(3):978-85.[150] McKenna FP, Horswill MS, Alexan<strong>de</strong>r JL. Does anticipation training affect drivers'risk taking? J Exp Psychol Appl. 2006 Mar;12(1):1-10.[151] Sagberg F, Bjornskau T. Hazard perception and driving experience among novicedrivers. Accid Anal Prev. 2006 Mar;38(2):407-14.[152] Razzak JA, Laflamme L. Limitations of secondary data sets for road traffic injuryepi<strong>de</strong>miology: a study from Karachi, Pakistan. Prehosp Emerg Care. 2005 Jul-Sep;9(3):355-60.[153] Tachfouti N, Bhatti JA, Nejjari C, Kanjaa N, Salmi LR. Emergency trauma care forsevere injuries in a moroccan region: conformance to French and World Health Organizationstandards. J Healthc Qual. 2010 Jun 30:1-9.69
[154] Rosenbloom T, Shahar A, Elharar A, Danino O. Risk perception of driving as afunction of advanced training aimed at recognizing and handling risks in <strong>de</strong>manding drivingsituations. Accid Anal Prev. 2008 Mar;40(2):697-703.[155] Milleville-Pennel I, Jean-Michel H, Elise J [Sic: inversion nom/prénoms par PubMed].The use of hazard road signs to improve the perception of severe bends. Accid Anal Prev.2007 Jul;39(4):721-30.[156] Mohan D, Tiwari G, Meleckidze<strong>de</strong>ck K, Fredrick MN. Road traffic injury preventionmanual. Geneva: World Health Organization and Indian Institute of Technology; 2006.[157] Welan<strong>de</strong>r G, Svanstrom L, Eckman R. Safety Promotion: An Introduction. Stockholm:Karolinska Institutet, Department of Public Health Sciences, Division of Social Medicine;2000.[158] Widome MD. Remembering as we look ahead: the three E's and firearm injuries.Pediatrics. 1991 Aug;88(2):379-83.[159] Salmi LR. Lecture critique et communication médicale scientifique : Comment lire,présenter, rédiger et publier une étu<strong>de</strong> clinique ou épidémiologique. 2 ème édition. Paris:Elsevier; 2002.70
Publications (peer-reviewed)Related to thesisArticles published1. Sobngwi-Tambekou J, Bhatti J, Kounga G, Salmi L.-R, Lagar<strong>de</strong> E. Road trafficcrashes on the Yaoundé-Douala road section, Cameroon. Accid Anal Prev. 2010Mar;42(2):422-6.2. Bhatti JA, Sobngwi-Tambekou J, Lagar<strong>de</strong> E, Salmi L.-R. Situational factorsassociated with road traffic crashes: a case-control study on the Yaoundé-Douala roadsection, Cameroon. Int J Inj Contr Saf Promot. 2010. [Epub Mar 30:1-8]Manuscript un<strong>de</strong>r review3. Bhatti JA, Razzak JA, Lagar<strong>de</strong> E, Salmi L.-R. Bur<strong>de</strong>n and factors associated withhighway work-zone crashes, Karachi-Hala road section, Pakistan. Inj Prev 2010.Manuscripts in preparation4. Bhatti JA. Razzak JA, Lagar<strong>de</strong> E, Salmi L.-R. Difference in police, hospital, andprehospital reporting of road traffic injuries to on an interurban road, Pakistan.5. Bhatti JA, Razzak JA, Lagar<strong>de</strong> E, Sobngwi-Tambekou J, Alioum A, Salmi L.-R.Hazard perception at high- and low-risk crash sites.Abstracts published6. Bhatti JA, Sobngwi-Tambekou J, Salmi L.-R, Lagar<strong>de</strong>, E. Road traffic injuries andassociated road-factors on Yaoundé-Douala road-section, Cameroon [Abstract]. Int JEmerg Med 2008;1:237. [Oral presentation in 12 th National Health Sciences ResearchSymposium, Karachi, 26-28 August, 2008].7. Bhatti JA, Salmi L.-R. Perception <strong>de</strong> la dangerosité <strong>de</strong>s tronçons acci<strong>de</strong>ntogènes chez<strong>de</strong>s conducteurs volontaires [Résumé]. Rev Epi<strong>de</strong>miol Sante Publique 2010 [souspresse]. [Présentation orale acceptée au IV ème congrès d’épidémiologie ADELF-EPITER, Marseille, 15-17 septembre 2010].8. Bhatti JA, Razzak JA, Lagar<strong>de</strong> E, Salmi L.-R. Bur<strong>de</strong>n and factors associated withwork-zone crashes on an interurban highway in Pakistan [Abstract]. Inj Prev 2010. [Inpress]. [Poster presentation accepted in Safety 2010 World Conference, London, 22-24 September, 2010]9. Bhatti JA, Razzak JA, Lagar<strong>de</strong> E, Salmi L.-R. Road hazard perception of high risksites in voluntary Pakistani drivers [Abstract]. Inj Prev 2010 [In press]. [Posterpresentation accepted in Safety 2010 World Conference, London, 22-24 September,2010].Other articles related to traffic injuriesArticles published1. Bhatti JA, Salmi L.-R, Lagar<strong>de</strong> E, Razzak JA. Concordance between road-mortalityindicators in high-income and low- and middle-income countries. Traffic Inj Prev2010;11(2): 173-7.2. Bhatti JA, Constant A, Salmi L.-R, Chiron M, Lafont S, Zins M, Lagar<strong>de</strong> E. Impact ofretirement on risky driving behavior and attitu<strong>de</strong>s towards road safety among a largecohort of French drivers (the GAZEL cohort). Scand J Work Environ Health. 2008Aug;34(4):307-15.3. Bhatti JA. Prioritization of road traffic injury prevention fund spending in <strong>de</strong>velopingcountries [Letter]. Inj Prev. 2010;16(3): 214-5.71
4. Farooq U, Bhatti JA, Siddiq M, Majeed M, Malik N, Razzak JA, Khan MM. Roadtraffic injuries in Rawalpindi city, Pakistan. East Mediterr Health J 2010. [In press]Abstracts published5. Bhatti JA, Salmi L.-R. Faiblesse <strong>de</strong>s capacités <strong>de</strong> mesurer l'impact d’une politique <strong>de</strong>sécurité routière dans les pays en développement (PED) : Le cas <strong>de</strong> la Région <strong>de</strong> l’EstMéditerranéen (EMRO) [Résumé]. Rev Epi<strong>de</strong>miol Sante Publique 2010 [sous presse].[Présentation orale acceptée au IV ème congrès d’épidémiologie ADELF-EPITER,Marseille, 15-17 septembre 2010].6. Bhatti JA, Salmi L.-R. Retirement transition: modification of driving behaviours andattitu<strong>de</strong>s toward road safety [Abstract]. Int J Emerg Med 2008;1:235. [Oralpresentation in 12 th National Health Sciences Research Symposium, Karachi, 26-28August, 2008].Contributed to Report:7. Eastern Mediterranean status report on road safety: Call for action. Cairo; WorldHealth Organization regional office for Eastern Mediterranean: 2010. ISBN 978 929021 701 5.Related to other injuriesArticles published1. Bhatti JA, Razzak JA. Railway associated injuries in Pakistan. Int J Inj Contr SafPromot. 2010 Mar; 17(1):41-44.2. Butt BA, Bhatti JA, Manzoor MS, Malik KS, Shafi MS. Experience of makeshiftspinal cord injury rehabilitation center established after the 2005 earthquake inPakistan [Letter]. Disaster Med Public Health Prep 2010;11(1):8-9.3. Farooq U, Majeed M, Bhatti JA, Khan JS, Razzak JA, Khan MM. Differences inreporting of violence and <strong>de</strong>liberate self harm related injuries to health and policeauthorities, Rawalpindi, Pakistan. PLoS One 2010 Feb 23;5(2): e9373.4. Tachfouti N, Bhatti JA, Nejjari C, Kanjaa N, Salmi L.-R. Emergency trauma care forsevere injuries in a Moroccan region: Conformance to French and World HealthOrganization standards. J Healthc Qual. 2010 [Epub Jun 30]Manuscript un<strong>de</strong>r review5. Bhatti JA, Shahid M, Mehmood A, Razzak JA, Akbar S, Akhtar U. Epi<strong>de</strong>miologicalpatterns of suici<strong>de</strong>-terrorism in civilian Pakistani population. Int J Inj Contr SafPromot 2010.Abstract published6. Bhatti JA, Shahid M, Mehmood A, Razzak JA, Akbar S, Akhtar U. Suici<strong>de</strong> terrorism:what, where, when, and how in Pakistan. J Pak Med Assoc 2010;60(1 Supp);S23-24.72
AppendicesIn<strong>de</strong>x of appendicesAppendix 1: Literature review on interurban road injury bur<strong>de</strong>n in LMICs ........................... 74Appendix 2- Published article - Study I................................................................................... 81Appendix 3: Study I supplementary results ............................................................................. 86Appendix 4: Manuscript in preparation – Study II .................................................................. 88Appendix 5: Article published – Study III............................................................................. 102Appendix 6: Article un<strong>de</strong>r review – Study IV ....................................................................... 110Appendix 7: Manuscript in preparation – Study V ................................................................ 123Appendix 8: Study V supplementary results.......................................................................... 13773
Appendix 1: Literature review on interurban road injury bur<strong>de</strong>n in LMICsMethodsSeveral approaches can be used to review transport safety research such as safety promotionmo<strong>de</strong>l , Haddon’s matrix, and the three ‘E’ (Enforcement, Engineering, and Education) [57,156-158]. For this systematic review, the public health approach was used. Consi<strong>de</strong>ring, thisinterrelationship of risk factor, crash outcome, trauma care, and their reporting, we reviewedstudies if their objective correspon<strong>de</strong>d with one or more of the following research interests:1. Assessing traffic injury bur<strong>de</strong>n (outcome) with respect to age, sex, and road user type.2. Assessing factors associated with outcome.3. Assessing trauma care of crash and injury event and their outcome.4. Assessing reporting mechanism and bias for assessing traffic bur<strong>de</strong>n outcomes, riskfactors, and trauma care.5. Assessing the impact of traffic safety interventions.The focus was studies with interurban road settings to document research needs. Originalresearch published in peer-reviewed journals in<strong>de</strong>xed on MEDLINE for a period from Jan1995 to Dec 2009 was inclu<strong>de</strong>d; reviews, editorials, commentaries, and letters to the editorwere exclu<strong>de</strong>d. Study title and abstract were searched using the following Medical SubjectHeadings (MeSH): “traffic acci<strong>de</strong>nt” and “<strong>de</strong>veloping countries” or individual names ofLMICs given in “Global Status Report on Road Safety.” Then articles concerning interurbanroads were selected. Articles written in English, French, Portuguese, Spanish, and RomanianLanguage were inclu<strong>de</strong>d if they satisfied the following criteria [159]: objective(s) clearlystated; inclusion criteria given and a<strong>de</strong>quate; ethical standards observed; reliable and validprincipal measures.ResultsA total of 3 663 abstracts were retrieved. After removing double entries and case reports, wewere left with 1 960 study abstracts (Figure 15). After careful search of studies conducted athighway or interurban road settings, 37 abstracts correspon<strong>de</strong>d to our criteria. Full texts of 32studies were available; however, we did not inclu<strong>de</strong> a study reporting the results of trafficmanagement intervention using simulation methods.Road crash and injury bur<strong>de</strong>nA Kenyan study showed that almost 60% of police-reported injury crashes occurred oninterurban roads [39]. Injuries including fatalities per crash were higher for interurban roads(1.8) than urban roads (1.4). Interurban traffic crash, fatality, and injury per vehicle-km werereported in one Egyptian study only. Average traffic fatality per km was 6 per 100 millionvehicles-km (range 3 to 11) in the prece<strong>de</strong>nt three-year period [18]. Injury risk was 35 per 100million vehicle-km (range 29 to 79). Fatality per crash ratio was on average 0.30 (range 0.17-0.43) on Egyptian interurban roads [18]. A Chinese study, where fatalities and daily trafficmeasures were available, showed that fatality could vary from 31.1 to 72.8 per 100 millionvehicle-km travelled on mountainous, un-separated interurban roads [48].Road users involved in these crashes were mostly aged 15-45 years-old and men [22, 31].Although some studies showed that pe<strong>de</strong>strians [37] and passengers of public transportvehicles [19] were over-involved in highway crashes, road user distribution was almost neverreported.74
Figure 15. Literature available for assessing research needs on interurban traffic safety(1995-2009)Original articlesN=1 960Related to highwayN=37Full text retrievedN=32Qualified for reviewN=31Bur<strong>de</strong>n CrashRoad CareN=5 * factors Behaviours EvaluationN=18 * N=9 * N=0InterventionsN=6 ** A research may have been counted for one or more categoriesQuality of RTC reportingOut of 18 studies on crash factors and outcome, nine used police-related sources [18, 19, 21,23, 26, 35, 37, 39, 48]. Among them, crash reports were analyzed in only four studies [19, 21,35, 37]. In three studies, data from traffic agencies was used to assess crash factors, includingtwo where <strong>de</strong>tailed reports were available [28, 40, 45]. Four studies used ambulance-relatedcrash reports which inclu<strong>de</strong>d information on injured patients [30-33]. Emergency <strong>de</strong>partment(ED) statistics for assessing RTI bur<strong>de</strong>n were used in three studies [22, 40, 43]. Only onestudy used multiple crash data sources but did not assess discrepancies between them [40].Quality of documentation was assessed for ED data, only type of data that showed that seatbeltuse was reported in 27.3%, crash factors in 18.8%, alcohol use in 18.2%, and extricationmethods in 3.1% of crash cases (including highways) reporting to ED [43].Crash types were mostly <strong>de</strong>fined using police or traffic agency specific <strong>de</strong>finitions,international <strong>de</strong>finitions such as the Microcomputer Acci<strong>de</strong>nt Analysis Package or Externalinjury co<strong>de</strong>s were available in only five studies [19, 30-33]. Further, traffic fatality in all crashbur<strong>de</strong>n studies was not <strong>de</strong>fined according to the WHO <strong>de</strong>finition requiring RTI patientfollow-up to 30 days. Similarly, in most studies, injury severity was <strong>de</strong>fined as ‘mild’ mostlywhen treated at crash scene and ‘severe’ when requiring a hospital visit or admission [30-33].Only one study <strong>de</strong>fined injuries by using the New Injury Severity Score (NISS) [36].We found four studies related to i<strong>de</strong>ntification and reporting of high-risk crash sites oninterurban roads in LMICs [22, 28, 35, 39]. A Kenyan study reported that a total of 145 highrisksites with five or more crashes (N=1 261) were i<strong>de</strong>ntified on rural road networks in oneyear, but no <strong>de</strong>tails were given regarding whether they were <strong>de</strong>fined using Global PositioningSystem (GPS) coordinates or other length measures [39]. A Turkish study showed thatinformation on traffic crashes is mostly recor<strong>de</strong>d in textual form and is not geo-referenced,which could pose problems in their i<strong>de</strong>ntification and improvement afterwards [28]. Theauthors used GPS coordinates of sites and assessed the usability of this system from a LMICpoint of view. Similarly, the Indian study examined the usefulness of GPS coordinates toi<strong>de</strong>ntify specific injury events on a highway [22]. Using hospital data and onsite investigation,75
they i<strong>de</strong>ntified a cluster of long bone fracture as a result of motorcycle crashes. In <strong>de</strong>pthanalysis revealed that the presence of speed bump without light resulted in these crashesduring low-light conditions. Further, a study from Hong Kong, a relatively resourceful setting,showed that in 12% of police reports, GPS coordinates were not recor<strong>de</strong>d correctly, limitingtheir utilization by road agencies [35].Crash factorsRoad user factorsContribution of road user, vehicle, and road situational factors in interurban crashes was givenin only one study [18]. This study showed that these were involved in 65.2% (range 58.6 to73.5) of interurban road crashes. These inclu<strong>de</strong>d loss of control (30.0%), over-speeding(12.4%), misjudging traffic gap (11.9%), sud<strong>de</strong>n slowing (7.9%), and careless overtaking(6.1%) [18].Almost all nine studies which analyzed factors associated with crashes and injuries, focussedon road user-related factors. Only three of these used case-control <strong>de</strong>signs whereas rest ofthem assessed factors associated with crash or injury severity using single source data andcross-sectional <strong>de</strong>signs (Table 17). For instance, a study showed that frontal and pe<strong>de</strong>striancollisions were more significantly associated with injury crashes than rear end collisions [21].Similarly, several studies confirmed that DWI was significantly associated with injury crasheson interurban roads [30, 31]. Moreover, not wearing a seat-belt or a helmet was shown to besignificantly associated with injury crashes in two different settings [31, 33, 36]. An interstatebus driver survey showed that Body Mass In<strong>de</strong>x (BMI) ≥ 30 km/m² was significantlyassociated with drowsiness while driving (50.0% vs. 30.1% in those with BMI < 30 kg/m²; P
BehavioursSpeedingPrevalence of risky road behaviours on interurban studies was assessed by few studies. Forinstance, a study reported that speed alone could account for over 50% of the RTCs reportedin Ghana [19]. In two different studies, over-speeding was measured as a function of vehicleand road type on interurban road sections [24, 25]. Both studies showed that 90% of thevehicles travelling through built-up areas on such roads excee<strong>de</strong>d posted speed limits. Evenon rural road sections, nearly half of the sampled vehicles had excee<strong>de</strong>d posted speed limits.Mean speeds varied with road types, with higher speeds noted for national highways than onregional and inter-regional highways. Further, the highest vehicle speeds were associated withprivate cars and large buses [25].Driving while intoxicated (DWI)A Nigerian study showed that 44.6% of the drivers involved in traffic violations on highwayshad Blood Alcohol Concentration (BAC) higher than 0.05% [27]. A Brazilian study showedthat alcohol consumption could be higher in some risk groups such as truckers, where weeklyinci<strong>de</strong>nce of DWI could be as high as 91% [38]. Nearly half consumed it at the fuel station.Similarly, the inci<strong>de</strong>nce of DWI in Cuban commercial drivers on highways was 8.2%(N=66/832; 95% CI=5.9, 10.4), with 20% of them having a BAC ≥ 0.05% [29].Sleepy drivingLong working hours was an important cause of sleepiness in Brazil [38]. A Peruvian highwaybus driver survey showed that up to 80% of them drove continuously for more than five hours[41]. Sleep <strong>de</strong>privation was measured in two different studies from Latin America, suggestingthat nearly one-fourth of commercial drivers slept less than 5 hours in the preceding 24-hourperiod [41, 44].Use of stimulant drugsIn relation to sleepiness in commercial drivers, several studies assessed stimulant use in thesetypes of samples. A Peruvian study reported that 14% of them used coffee, 4% smoked, 4%chewed coca, and 2% took alcohol mixed with coca leaves [41]. Higher caffeine use (95%)was reported elsewhere [44]. A Turkish study showed that 75% of such drivers used amedicinal drug with caffeine and paracetamol while driving, mostly for headache and fatigue.Its use resulted in sedation for 30 to 60 min (78.5%), stumbling (21.5%), and loss in visualacuity (6.5%) [47]. Two Brazilian studies reported that stimulants such as amphetamines wereused by commercial truck drivers to cope with sleepiness [38, 44]. According to one [44], itsuse was 66%, while the other reported it to be around 11%. These substances were availableon the highway and most of them used it for night driving [38].Pre-hospital and essential trauma careWe found four studies conducted on the Mexico-Cuernavaca highway that indicated that therewas some pre-hospital care system on those road sections [30-32]. A brief <strong>de</strong>scription wasavailable, but structure, process, and outcome of care were not <strong>de</strong>scribed. An urban hospitalbasedstudy showed that 15.9% of all injured patients received in ED had been involved ininterurban road crashes [43]. A majority of these patients were transported by private means.None of the study reported commonly known evaluation parameters such as response time orlength of stay for those injured in interurban road crashes.Evi<strong>de</strong>nce on interventionsSeveral prevention and control measures were evaluated, almost all in non-controlled studieswith a before and after study <strong>de</strong>sign (Table 18). A study showed that installation of rumblestrips on a busy junction on a highway <strong>de</strong>creased crashes by 35% and fatalities by 55% [19]; a51-percent <strong>de</strong>crease in pe<strong>de</strong>strian collisions was recor<strong>de</strong>d. This intervention was four times77
more cost-effective than re<strong>de</strong>signing a junction or installing a pe<strong>de</strong>strian bridge. Similarly, aUgandan study observed the influence of overhead pe<strong>de</strong>strian bridge installation onpe<strong>de</strong>strian crashes on the Kampala-Jinja highway [37]. No significant differences wereobserved in pe<strong>de</strong>strian crash count between the two periods. Females and children used thebridge more than men and adults. A convenient sample of 123 pe<strong>de</strong>strians reported that52.0% of them used it. A majority of those not using it reported extra walking distance andtime and high stairs as causes of their non-use.Traffic enforcement with increased fines and a rigid penalty scoring on Brazilian highwayssystem <strong>de</strong>creased fatalities by 24.7%, hospital admissions 33.2%, and RTCs by 21.3%.Stricter penalties almost halved the tickets issued to drivers [40]. Similar results wereobserved on four sub-urban road sections in Uganda, when more resources were provi<strong>de</strong>d tothe highway police. A<strong>de</strong>quately equipped traffic police facilitated a drop in road fatalities by27.3% (95% confi<strong>de</strong>nce interval (95% CI)= 6.0; 48.9].[23]. Consi<strong>de</strong>ring average age ofperson dying due to crash and life expectancy, traffic enforcement could save up to USD 27(95% CI=15-118] per disability adjusted life year saved year at 3% discount rate. Trafficenforcement appeared to be one of the most cost-effective behavioural interventions andoverall system improvement approach.Two separate studies showed that road environmental improvements lead to significantreductions in injury crash rates. For instance, multi-sector intervention involving removal ofhard metal bars and installation of road furniture, luminous traffic signs, and security fence<strong>de</strong>creased injuries from 2.1 to 1.4 per 10 000 vehicles adjusted on seat-belt use on a Mexicanhighway [32]. Similarly, security fence installation on a mountainous Chinese highway<strong>de</strong>creased overall traffic crashes by 43.8% and severe crashes by 70.8% [48]. Overall <strong>de</strong>signimprovement on the same highway led to a <strong>de</strong>crease in crashes by 37.2% and traffic fatalitiesby 47.1% as compared to the other highways adjusted on traffic counts.78
Table 17. Analytical studies of traffic crash and injury risk on interurban road sections in <strong>de</strong>veloping countries.Author (year) Objective Study <strong>de</strong>sign Setting Data Outcome ResultsAlmeida, et al Factors associated with Cross-sectionalHighway police data for year 2004(2009)injury crashesHijar, et al (1996)Hijar, et al (1998)Hijar, et al (2000)Liu, et al (2003)Majdza<strong>de</strong>h, et al(2008)Rey <strong>de</strong> Castro, etal (2004)Souza, et al (2005)Viegas et al (2005)Association of non-use ofseat belt with injuryseverityAssociation of alcoholintake with injury crashesFactors associated withhighway crashesDriver sleepiness and riskof crashFactors associated withinjuries in drivers &motorcyclistsAssociation of fatigue anddrowsiness with reportedcrashes in bus driversAssociation of sleepinesswith crashesPrevalence of risk factorsfor sleep apnoeasyndrome in commercialbus driversOR: adjusted odds ratio95% CI: 95% confi<strong>de</strong>nce intervalNISS: New Injury Severity ScoreCross-sectionalFe<strong>de</strong>ralhighway163, BrazilMexico–Cuernavacahighway,MexicoSeven-month ambulance data (1994)Injury crash inwhich at leastone person hasbeen injured ordiedCrash requiringhospitaltreatmentCross-sectional As above As above Crash requiringhospitaltreatmentCase-control As above Three-month ambulance data (1996:Cases, involved in crash & transportedby ambulance; controls, not involved ina crash, recruited from two points.Case-controlCase-controlCross-sectionalCross-sectionalCross-sectionalHighways inHuanggudistrict,ChinaQazvin-LoshanRoad, IranNorthern PanAmericanhighway,PeruFe<strong>de</strong>ralhighways,BrazilFe<strong>de</strong>ralhighways,BrazilNine-month traffic & police data (2001-02): Cases, drivers involved in a trafficcrash; controls, randomly selected withpolice officers from 28 road locationsFour-month traffic & police data(2005): Cases, injured drivers &motorcyclists involved in a crash;controls, uninjured drivers &motorcyclists on the same road involvedin a crash.Bus drivers operating at bus-stand onkm 10 of the highway. Interviews wereconducted with 238 out of 400 driversworking on the bus stand.Interviews conducted with 260 truckdriversInterviews conducted with 262 maleinterstate bus driversCrashPolice reportedcrashMild trafficinjury (NISS ≤15) and mo<strong>de</strong>ratetraffic injury(NISS > 15)Crash or nearcrashAssociations were assessed for three different set of in<strong>de</strong>pen<strong>de</strong>nt variables:Surface condition: Substandard pavement OR=1.89; 95%CI=1.32-2.70 (Reference: unpaved)Crash types: Frontal (OR=14.14; 95%CI=8.96-22.32) and pe<strong>de</strong>strian (OR=35.95; 95%CI=8.10-159.92) collisions (reference: rear collisions)Contributory factors: Highway maintenance problems (OR=4.35; 95%CI=1.94-9.75) anddisobeying traffic signs (OR=5.69; 95%CI=2.01-16.12) (reference: not keeping safe distance)Not wearing a seat-belt (OR=2.94; 95% CI=1.13-7.66) was significantly associated with injurycrashAlcohol intake (OR=6.09; 95%CI=1.55-24.00) was significantly associated with injury crashesAge 10 (OR=2.07; 95%CI=1.30-3.29) and night or shift work (OR=2.14; 95%CI=1.50-3.05) were significantly associated withpolice reported crash. Associations remained significant even after removing those with alcoholintake <strong>de</strong>termined by breath-analyzers applied to both case and control groups.Female sex (OR=7.78; 95%CI=2.77-21.85), safety equipment use (OR=0.44; 95%CI=0.23-0.84),and motorcycle involvement (OR=5.06; 95%CI=1.42-18.02) were significantly associated withmild injury crashes.Female sex (OR=4.78; 95%CI=1.36-16.80) and adverse weather condition (OR=4.32,95%CI=1.13-16.50) were significantly associated with mo<strong>de</strong>rate injury crashes.Forty five percent drivers reported having a crash or near crash in a prece<strong>de</strong>nt period. Drivinghours per day was significantly higher in drivers who reported a crash or near crash than driversnot reporting such event (7.9 vs. 6.9 hours, P=0.003). Similarly, 35% drivers reported drivingwhile sleepy, which was significantly higher in those reporting a crash or near crash than driversnot reporting such event (P
Table 18. Traffic injury intervention studies on interurban road sections in <strong>de</strong>veloping countries.Author (year) Intervention Study <strong>de</strong>sign Setting Data Outcome ResultsAfukaar (2003) Rumble strips on an urbanAccra-Kumasi Police dataintersectionhighway, GhanaHijar , et al (1999)Bishai, et al (2008)Poli <strong>de</strong> Figueiredo, etal (2001)Mutto, et al (2002)Zhou, et al (2005)Road furniture: luminoussigns, traffic lights, rumblestrips, and replacement oflateral metal bars bysecurity fenceTraffic police enforcementwith vehicles and speedcamera1. Increased fines2. Rigid penalty scoringOverhead pe<strong>de</strong>strianbridge in a locality situatedon a highway1. Guardrail installation2. Design improvementsBefore and afterstudy withoutcontrolBefore-afterwithout controlgroupBefore and afterstudy withoutcontrolBefore and afterstudy withoutcontrol.Interventionapplied in 1998Before and afterstudy withoutcontrolTwo comparisons;1. Before afterstudy (guardrail)2. Control sections(<strong>de</strong>signimprovements)Mexico–Cuernavacahighway, MexicoFour highwaysentering Kampala,UgandaInterstate highways,BrazilKampala-JinjahighwayThree sections ofNational highway319 Wulong(intervention),Pengshui &Qianjiang countiesAmbulance(pre-hospitalcare data) fortwo period1994 & 1996Police dataTraffic agencydata & level Itrauma caredata for 1998compared to1997Police dataTraffic policePer year1. Crash (N)2. Crash type3. Fatality (N)Per 10 000vehiclestravelled1. Crash2. InjuryPer year1. Citation (N)Per month2. Fatality (N)1. Crashes2. Deaths3. Injuries4. Citations5. Emergencyadmissions1. Crash2. Crash severity1. Crashes2. Crash severity3. DeathsRoad crashes <strong>de</strong>creased by 55% and road fatalities <strong>de</strong>creased by 35%. Head-on, si<strong>de</strong>-swipes,and hitting fixed object crashes <strong>de</strong>creased by 100%, whereas pe<strong>de</strong>strian involving crashes<strong>de</strong>creased by 51%.No significant differences were observed for crashes between the two periods. Injury per10 000 vehicles significantly reduced from 2.1 to 1.4 over the same period. Results wereadjusted on age, speed, use of seat belt, alcohol intake, and external causes of injuries.Number of citations increased from USD 72 000 in before to 327 311 in after period. A 17%drop in road fatality per month was recor<strong>de</strong>d.All the outcome variables <strong>de</strong>creased in the after period as compared to before period. Crashes<strong>de</strong>creased by 21.3% (327 640 to 257 688); road <strong>de</strong>aths <strong>de</strong>creased by 24.7% saving 5 962lives; traffic citations <strong>de</strong>creased by 49.5% (601 977 to 304 785). Similarly, emergency roomadmissions <strong>de</strong>creased by 33.2% (787 to 526).Total crashes augmented from 35 to 71. The difference was +74.5% (51 vs. 13) for minor,+21.4% (17 vs. 14) serious, and -75.0% (2 vs. 8) for fatal crash.As compared to before period, traffic crashes <strong>de</strong>creased by 43.6% (84 vs. 149) and severecrashes <strong>de</strong>creased by 70.8% (7 vs. 24) in the after period. No changes in overall fatalitieswere observed; as compared to similar road sections, a <strong>de</strong>crease in crashes (≥ -37.2%) andtraffic <strong>de</strong>aths (≥ -47.1%) was observed in the same period (1997-2001).80
Appendix 2- Published article - Study I81
Appendix 3: Study I supplementary resultsFigure 16. Weekly pattern of traffic fatalities and injuries on Yaoundé-Douala roadsection (2004-2007)400350FatalitiesInjuries300250N 200150100500Monday Tuesday Wednesday Thursday Friday Saturday SundayDayFigure 17. Hourly pattern of traffic crashes and fatalities on Yaoundé-Douala roadsection (2004-2007)908070CrashesFatality60N504030201000 1 2 3 4 5 6 7 8 9 10 11 12 13 14 15 16 17 18 19 20 21 22 23Hour86
Table 19. Traffic fatalities and injuries according to crash types and causes on Yaoundé-Douala road section (2004-3007)Crashes Non-fatalinjuriesInjury percrashFatalities Fatalityper crashN N NCrash typesVehicles travelling in the same direction 181 211 1.2 31 0.2Single vehicle running off the road 180 399 2.2 69 0.4Vehicles travelling in opposite directions 156 313 2.0 136 0.9One or more pe<strong>de</strong>strians 141 150 1.1 71 0.5One or more still or manoeuvring vehicles 84 122 1.5 11 0.1One or more two-wheeled motor vehicles 81 99 1.2 29 0.4Intersection 62 104 1.2 3 0.1Others 50 96 1.9 24 0.5Crash causes *Human factorsHazardous overtaking 268 454 0.6 87 0.3Excessive speed 182 355 2.0 74 0.5Inattention, distraction 136 177 1.3 27 0.2Loss of control 120 194 1.6 42 0.4Hazardous manoeuvre 114 124 1.1 18 0.2Unsafe parking 74 126 1.7 14 0.2Other human factors 50 83 1.1 40 0.8Any human factors 700 1093 1.6 224 0.3Mechanical failuresTyre puncture, burst or loss 98 266 2.7 66 0.7Other mechanical failures 71 153 2.2 38 0.5Any mechanical failures 168 418 2.5 103 0.6Environmental factors 37 49 1.3 21 0.6Unknown causes 91 84 0.9 56 0.6Total 935 1494 1.6 374 0.4* A crash may appear more than one time87
Appendix 4: Manuscript in preparation – Study IITITLEDIFFERENCES IN POLICE, AMBULANCE, AND EMERGENCY DEPARTMENTREPORTING OF TRAFFIC INJURIES ON KARACHI-HALA ROAD, PAKISTANAUTHORS1. Junaid Ahmad BHATTI a,2. Junaid Abdul RAZZAK b3. Emmanuel LAGARDE aa, c, d4. L.-Rachid SALMIAFFILIATIONSa. Equipe Avenir « Prévention et Prise en Charge <strong>de</strong>s Traumatismes », Institut National <strong>de</strong> laSanté et <strong>de</strong> la Recherche Médicale Unité 897 (INSERM U897), Bor<strong>de</strong>aux, France.b. Department of Emergency Medicine, The Aga Khan University, Karachi, Pakistan.c. Institut <strong>de</strong> Santé Publique, d’Epidémiologie et <strong>de</strong> Développement (<strong>ISPED</strong>), UniversitéVictor Segalen Bor<strong>de</strong>aux 2, Bor<strong>de</strong>aux, France.d. Service d’information médicale, Centre Hospitalier Universitaire <strong>de</strong> Bor<strong>de</strong>aux, Bor<strong>de</strong>aux,France.CORRESPONDING AUTHORJunaid A. BHATTIEquipe Avenir « Prévention et Prise en Charge <strong>de</strong>s Traumatismes »Institut National <strong>de</strong> la Santé et <strong>de</strong> la Recherche Médicale Unité 897 (INSERM U897)146 rue Léo Saignat33076 Bor<strong>de</strong>aux ce<strong>de</strong>xFranceTel: + 33 (5) 57 57 45 50Fax: + 33 (5) 57 57 45 28Email: junaid.bhatti@yahoo.comCOUNTSAbstract: 213 wordsManuscript: 2 782 wordsReferences: 36Tables: 3Figure: 188
ABSTRACTBackground: Previous research in <strong>de</strong>veloping countries assessed discrepancies in policeRoad Traffic Injury (RTI) reporting for urban settings only. The objective of this study was toassess differences in RTI reporting among police, ambulance, and Emergency Department(ED) datasets on an interurban road section in Pakistan.Methods: The study setting was 196-km long Karachi-Hala road section. RTIs reported to thepolice, Edhi Ambulance Service (EAS), and five EDs in Karachi during 2008 (Jan to Dec)were compared. Further, records from these data were matched to assess their ascertainment.Results: A total of 143 RTIs were reported to the police, 531 to EAS, and 661 to ED. Fatalityper hundred traffic injuries was twice as high in police records (N=27, 18.8%) than inambulance (N=55, 10.4%) and hospital records (N=60, 9.1%). On the contrary, pe<strong>de</strong>strian andmotorcyclist involvement per hundred traffic injuries was twice as low in police records(N=11, 7.7%) than in ambulance (N=89, 16.7%) and hospital records (N=286, 43.3%). Basedon matching, police recor<strong>de</strong>d 22.6%, EAS 46.2%, and ED 50.4% of the 119 reportedly diedpatients. Similarly, police data accounted for 10.6%, EAS 43.5%, and ED 54.9% of the 1 095reportedly injured patients.Conclusion: Police reporting, particularly of non-fatal RTIs and those involving vulnerableroad users, should be improved in Pakistan.KEYWORDS: Highway; injury severity; surveillance; traffic acci<strong>de</strong>nt.ABBREVIATIONS: EAS, Edhi Ambulance Service; ED, Emergency Department; HIC,High-Income Country; LMIC, Low- and Middle-Income Country; NHMP, National Highway& Motorway Police; NISS, New Injury Severity Scores; RTC, road traffic crash; RTI, roadtraffic injury; US, United States of America; WHO, World Health Organization; $, Dollar.89
BACKGROUNDPakistan, located at the junction of Middle-East, South-East, and Central Asia , is the sixthmost populous nation of the world [1]. According to transport authorities, approximately 1.4million Road Traffic Crashes (RTCs) occurred in Pakistan in 1999, resulting in over 7 000fatalities [2]. Two in<strong>de</strong>pen<strong>de</strong>nt population-based surveys estimated inci<strong>de</strong>nce of Road TrafficInjuries (RTIs) around 15 to 17 per 1 000 persons per year [3, 4]. These injuries contributesignificantly to the workload in hospitals, leading to direct costs of over 1 billon US$ to thePakistani economy [5, 6].Interurban road sections are the backbone of Pakistani economy. Its strategic road network ofapproximately 8 000 km plays a significant role in transport, as it carries more than 80% ofinland passenger and freight traffic [2, 7]. Although these road sections account for 4% of theentire network, they account for a high proportion of traffic fatalities (27%) [8]. Previousresearch in Pakistan has shown that injury severity was higher for crashes in rural areas, butno distinction was ma<strong>de</strong> between interurban or other rural roads [9]. Higher speeds, presenceof vulnerable road users, and complex road traffic conditions can explain this high fatalityratio, but no comparison indicators were available for these road sections [10].Police records remain, to date, the most used source for evaluating interurban traffic safety,because of geographical distances and complexity of trauma care in such settings [9, 11]. Theuse of these statistics only, however, can lead to un<strong>de</strong>restimation of RTI bur<strong>de</strong>n in Low- andMiddle-Income Countries (LMICs) like Pakistan [12]. A recent World Health Organization(WHO) report showed that actual traffic fatalities could be 4 to 10 times higher than theofficial statistics in Pakistan [13]. A previous study in Karachi city showed that police recordsaccounted for only 56% of traffic fatalities and 4% of such severe injuries [14]. No notableresearch has been carried out to compare the differences in injury reporting by linkingdifferent datasets for interurban road settings in Pakistan [12, 13]. The World Bank reportedthat interventions with proven effectiveness exist but their implementations are impe<strong>de</strong>d bythe lack of documenting the specific disease bur<strong>de</strong>n in LMICs [15]. The objective of thisstudy were to assess differences in crash and injury reporting between police, ambulance, andEmergency Department (ED) datasets on an interurban road section in Pakistan. Further, thesedatasets were linked to assess variations in traffic fatality and injury per vehicle-kilometres(vehicle-km) travelled on the road section.METHODSThe study setting was the 196-km-long Karachi-Hala road section (km 16 to km 212 fromKarachi city centre). This is a four-lane highway, two lanes in each direction [16]. The lanesare separated by a ground surface, but there are no physical barriers. Traffic counts range16 356 to 24 707 vehicles per day on this section [17]. This high traffic count can beexplained by the economic activity in Karachi, the most populous city of Pakistan, whichaccounts for 70% of the government’s revenue through tra<strong>de</strong> and industry [18]. In thisretrospective study, information on traffic injuries reported to highway police, ambulanceservice, and ED during 2008 (Jan to Dec) was collected and compared.Police dataSince 2004, the National Highway & Motorway Police (NHMP) ensures traffic enforcementon this road section. Administratively, this section is consi<strong>de</strong>red as Sector I of South-Zone ofNHMP and is divi<strong>de</strong>d further in four 46- to 51-km-long beats: beat 35 (km 16 to 62), beat 3490
(63 to 114), beat 33 (115 to 162 km), and beat 32 (163 to 212 km). NHMP <strong>de</strong>ploys four motorvehicles and four patrolling officers in an eight-hour shift on these beats [19].For every crash, a standard acci<strong>de</strong>nt analysis report is filed by the attending NHMP officerduring the first 24 hours [20]. A copy of this report is kept in the NHMP regional office.Similarly, <strong>de</strong>tails on crash and those involved are recor<strong>de</strong>d on a separate acci<strong>de</strong>nt register.From these reports and registers, information was extracted on time, date, location of crash,and whether it was fatal, involved injury, or was without injury. We also extractedinformation on name, age, sex, outcome (<strong>de</strong>ad; severe injury, <strong>de</strong>fined as transported tohospital; and mild injury, <strong>de</strong>fined as not transported to hospital), and hospital brought to ofthose involved in crashes.Ambulance dataAmbulance records were obtained from Edhi Ambulance Service (EAS) logbooks. EAS is thelargest private philanthropic ambulance service in the world [21]. Since 1973, the EAS hasbeen progressively increasing its ambulance posts from main Pakistani cities to the importanthighways in Pakistan [22, 23]. For transporting injured patients, EAS has established sixambulance posts, mostly near main towns on Karachi-Hala road section: 1/ Sohrab Goth (12km from Karachi centre), 2/ Karachi toll plaza (km 28), 3/ Edhi centre (km 56), 4/ Nooriabad(km 94), 5/ Hala Naka (km 160), and 6/ Hala city (km 212). This service is freely available toinjury patients, and funds are raised by transporting other patients. Ambulance staff consistsof, in most of cases, only the driver. A clerk at the post can accompany the driver if he thinksthis justified, for instance in case of crash with multiple patients. Ambulance communicateswith emergency post through a wireless system or by cell phone.RTI patients or bystan<strong>de</strong>rs can contact EAS using the free emergency access number 115,which connects them to the main city centre [21]. Information is then transmitted by wirelessor cell phone to nearby posts, which finally dispatches the ambulance(s). After reaching thescene, injured and <strong>de</strong>ad patients are separated. Those severely injured are transported to thenearest hospital; preference is given to the government hospital if available. All informationon the RTI intervention, including crash location, RTI patient i<strong>de</strong>ntity and outcome, is thentransmitted by wireless or telephone to the regional centre, which records the information in acentral log book. We photocopied these log books from the regional centre at Karachi. Crash<strong>de</strong>tails such as date, time, location, and whether it was fatal or involved injury were extractedfrom these books. Similarly, road user <strong>de</strong>tails such as name, sex, age, user type (pe<strong>de</strong>strian,motorcycle ri<strong>de</strong>r, or vehicle occupant), and outcome (died, including when the person died atcrash scene, during transport, or at ED; injured and transported, including hospital taken to;injured and not transported) were extracted from these books [21].Hospital recordsThe Road Traffic Injury Research & Prevention Centre (RTIRP) at the Jinnah Post GraduateMedical Centre (JPMC) has been working since September 2006 [24]. This centresystematically collects, on standard Proforma sheets, information on RTI patients presentingat the ED of the five largest teaching hospitals in Karachi: 1/ JPMC, 2/ Abbasi ShaheedHospital, 3/ Civil Hospital Karachi, 4/ Liaqat National Hospital, and 5/ The Aga KhanUniversity Hospital. Details on their data collection methods are available elsewhere [24, 25].This dataset inclu<strong>de</strong>s information on the crash date, time, and location as well as patient’sname, age, sex, road user type (pe<strong>de</strong>strian, motorcycle ri<strong>de</strong>r, or vehicle occupant). Furtherinformation on whether the patient was wearing a helmet or seat belt was available. The NewInjury Severity Scores (NISS) [26] and outcome (discharged, admitted/referred, or died) of91
patients were recor<strong>de</strong>d during their stay in the ED. Information on RTI patients involved incrashes on selected road section was extracted from this dataset.AnalysisAll information was recor<strong>de</strong>d on Excel® spreadsheets. We compared percentages for crashand injury patient characteristics for three datasets. For the ED dataset, we compared outcomefor following NISS categories: 1 to 3; 4 to 8; and ≥ 9. Records from the three datasets werethen matched for crash date, name, age, and sex of RTI patients involved. For matchedrecords, we i<strong>de</strong>ntified differences in reported outcome. A person reported injured in policestatistics, but <strong>de</strong>ad in ambulance data was consi<strong>de</strong>red as <strong>de</strong>ad. Number of unique <strong>de</strong>aths andinjuries were then assessed by removing records appearing in two or more datasets.Ascertainment rate for police, ambulance, and ED records as compared to these total fatalitiesand injuries were computed [27]. Capture-recapture methods were not used to estimate roadbur<strong>de</strong>n because RTIs away from Karachi might not have the same probability of beingcaptured in the ED dataset. These unique records and traffic counts from NHMP were used tocompute overall traffic fatality and injury rates per vehicle-km in 2008 for this road section[28].RESULTSCrash and injury outcomeIn 2008, police reported 43 crashes, whereas 255 crashes were reported to EAS and 449 toED. One out of two police reported crashes (N=19, 44.4%) was fatal, whereas this proportionwas 14.5% (N=37) for those reported to EAS, and 10.4% (N=47) for ED. No information oncrash outcome was available in 13.3% of EAS reported crashes, and 6.7% of those reported toED.A total of 143 RTIs were reported to police, 531 to EAS, and 661 to ED. Monthly trendsindicated higher proportions of RTIs in June and July 2008. Over half of police-reportedinjury patients received hospital care (N=80, 55.9%). Half of these patients (N=40), injuredbetween km 16 and km 120 were treated in Karachi; RTIRP hospitals treated 17 of them.Nearly one fifth of RTI patients reported in police records died (N=27, 18.8%), whereas thisproportion was 10.4% for EAS- and 9.1% for ED-reported patients (Table 1). One fourth ofpolice-reported injury patients (N=25.2%) were not transported to the hospital, whereas thiswas 9.0% for EAS-reported patients (N=48).Out of 661 patients presenting to ED, 47.7% (N=315) arrived by private means, whereas43.0% (N=284) arrived in ambulances. Police transported only four of these patients, and noinformation was available on the remaining 58 patients. In the ED, those with a NISS from 4to 8 had a higher likelihood of hospital admission than those with NISS from 1 to 3 (81.0%vs. 19.0%, P
wheeled vehicles accounted for a majority of injuries in the three datasets: 83.9% in police,75.9% in EAS, and 49.5% in ED. In the ED, only 15.7% (N=21) of the 154 injury patientsriding motorcycles were wearing helmets. Similarly, only three out of 93 four-wheeledvehicle occupants were wearing a seat belt at time of crash.Concordance between databasesMatching yiel<strong>de</strong>d 1 214 unique records from the three datasets (Figure 1). A total of 108patients were found in two or more datasets, including 13 who were found in all datasets, 28who were found in police and EAS datasets, and 14 who were found in both police and EDdatasets; 93 records were common between ambulance and ED datasets. Discrepancies wereobserved for outcome of injuries reported in police and ambulance records (Table 2): four outof the 17 injured in police dataset were reported <strong>de</strong>ad in EAS records. Similarly, one of eightinjured in police records was reported <strong>de</strong>ad in ED records, and nine of 84 injured patients inEAS were reported <strong>de</strong>ad in ED records.Ascertainment of road fatalities and injuriesBased on matching, 119 unique patients were reported to have died in 2008 on this interurbanroad section (Table 3). Police recor<strong>de</strong>d 22.6%, EAS 46.2%, and ED 50.4% of them. Similarly,a total of 1 095 patients were reported injured in three datasets. Police accounted for 10.6%,EAS 43.5%, and ED 54.9%. Traffic fatality was 54 <strong>de</strong>aths and injuries were slightly over 500per 10 9 vehicle-km travelled on this road section. Matching of nameless police and ambulancerecords, when any of the crash dates, time, age, and sex <strong>de</strong>tails was available, <strong>de</strong>creased theoverall estimates by 4 <strong>de</strong>aths and 73 injuries. Corrected traffic fatality was 53 <strong>de</strong>aths andinjuries were 467 per 10 9 vehicle-km travelled on this road section.DISCUSSIONThis study showed crash and injury numbers reported by police were several times less thanambulance and ED data on this road section in a one-year period [27]. Fatality per hundredtraffic injuries was twice as higher in police records than in ambulance and hospital records.On the contrary, pe<strong>de</strong>strian and motorcyclist involvement per hundred traffic injuries wastwice as less in police records than in ambulance and hospital records. Compared to overallestimated RTIs, police reported one in five traffic fatalities and one in ten severe injuries onthis road section.Un<strong>de</strong>rreporting in police traffic crash data cannot be <strong>de</strong>nied, particularly in LMICs. Thisstudy showed that this could be particularly high for road sections outsi<strong>de</strong> the cities. Policeaccounted for only one of five traffic fatalities, compared to one out of two in Karachi city[14]. This type of documenting disparity could jeopardize the resource allocation for trafficsafety interventions in these settings [29]. Police reporting has been more reliable andcomplete in high-income countries (HICs) and this improvement should be an importantpriority in LMICs like Pakistan, to better estimate and monitor traffic safety programs in thesecountries [12, 30].The proportion of traffic fatalities was higher in police than in both EAS and ED records. InPakistan and many other LMICs, police performance is judged by few event numbers [31].Since RTCs are part of these statistics, higher traffic injury numbers could reflect poorenforcement. It is possible that police records did not inclu<strong>de</strong> non-fatal traffic injuries becauseof such reasons [14, 19]. These results showed that this differential reporting needs to beconsi<strong>de</strong>red seriously. Documentation might be improved by implementing performanceevaluation based on number of crashes in which the police intervened for public safety [31].93
This might motivate police officers to report RTIs, to better i<strong>de</strong>ntify the high-risk groups andcrash sites [13].Furthermore, police reported fewer pe<strong>de</strong>strian and motorcyclist involvement per hundredtraffic injuries. There could be several explanations: Firstly, it is likely that these injuries tookplace near built-up areas, so patients were transported by bystan<strong>de</strong>rs or ambulances directly tohospital, without police intervention [13, 32]. Secondly, it is possible that such road usersbelonged to lower socioeconomic status and did not want to be involved in cumbersome an<strong>de</strong>xpensive legal procedures, and settled their issues without police [19]. Nevertheless, effortsare required to improve documentation of such road users to better <strong>de</strong>sign and implementeffective crash prevention policies [33].Limitations of secondary datasets such as ambulance or ED for RTC prevention have beenconsi<strong>de</strong>red previously in Pakistan [34]. Availability of NISS was exceptional in this study,because of the existing RTI surveillance system [24]. It was observed that both EAS and EDrecor<strong>de</strong>d the approximate location of traffic crash (town, motel…), whereas police datainclu<strong>de</strong>d the km location of the sites. Linking of these datasets permitted to show a high crashand injury bur<strong>de</strong>n, but failed to i<strong>de</strong>ntify high-risk crash sites. Moreover, seat-belt and helmetuse was not reported in a majority of ED patients, and not recor<strong>de</strong>d at all in police data. Thisshows the need to improve police reporting of crash factors, information that could help in<strong>de</strong>veloping policies adapted to local settings [11].Finally, this study may have some limitation regarding RTI estimates because names were notavailable for one of three police and one of five ambulance records [34]. Some of these policeand ambulance records could be matched with only one common parameter, thus RTIs couldbe slightly overestimated in this study. Nevertheless, corrected fatality and injury rates werehigher than a similar road in an HIC [35]. Moreover, fatality numbers could be even higher,because patients were not followed for over 30 days, as in the WHO <strong>de</strong>finition [13].Furthermore, half of the police-reported patients were injured away from Karachi and weretransported to hospitals outsi<strong>de</strong> Karachi [32]. This shows that the ascertainment of policerecords could be much lower than reported in this study.In conclusion, interurban traffic crash bur<strong>de</strong>n appears to be several times higher in Pakistanthan other HICs [35]. Police RTI documentation, particularly of non-fatal injuries and thoseinvolving vulnerable road users, should be improved in Pakistan [12, 14, 34]. Revising policeperformance evaluation, to account for number of traffic crashes in which the policeintervened, might motivate officers to report RTIs [13, 36]. Furthermore, a linked andcomprehensive database would be useful to monitor and implement traffic safetyinterventions in Pakistan [14].ACKNOWLEDGEMENTSWe are especially thankful to Dr. Aftab Ahmed PATHAN, Deputy Inspector General ofPolice, Mr. Irshad SODHAR, Senior Patrolling Officer, and Mr. Naeemullah SHIEKH , SeniorPatrolling Officer, National Highway and Motorway Police south sector III office, Pakistanfor their support in data collection. We are also thankful to Pr. Rasheed JOOMA (JPMC) andMr. Ameer HUSSAIN (JPMC) for providing us the ED data. Special thanks to Mr. FaisalEDHI for providing us the EAS log books.ETHICAL APPROVAL94
All the police, ambulance, and ED data used in this study was publicly accessible and dataanalysis was conducted with approval from their respective institutions. Furthermore, thismanuscript does not permit i<strong>de</strong>ntification of any RTI patient.AUTHORS’ CONTRIBUTIONThis study is the part of PhD thesis work of JB supervised by LRS who contributed equally tostudy conception, <strong>de</strong>sign, analysis, and manuscript writing. JAR and EL provi<strong>de</strong>d technicalhelp in all of the above work.COMPETING INTERESTSThe authors <strong>de</strong>clare that they have no competing interests.FUNDINGFirst author is the PhD candidate at Université Victor Segalen Bor<strong>de</strong>aux 2. This position isfun<strong>de</strong>d by Higher Education Commission of Pakistan. Institut National <strong>de</strong> la Santé et <strong>de</strong> laRecherche Médicale Unité 897, France, fun<strong>de</strong>d the logistics for data collection. Fundingbodies had no input in study <strong>de</strong>sign, analysis and interpretation of results.REFERENCES1. Central Intelligence Agency: The World Factbook. Langley, VA: Directorate ofIntelligence; 2009.2. National Transport Research Centre: Manual of road safety improvement by theuse of low cost engineering countermeasures. Islamabad: National TransportResearch Centre, National Highway Authority, and Finnroad OY; 1999.3. Ghaffar A, Hy<strong>de</strong>r AA, Masud TI: The bur<strong>de</strong>n of road traffic injuries in <strong>de</strong>velopingcountries: the 1st national injury survey of Pakistan. Public health 2004,118(3):211-217.4. Fatmi Z, Had<strong>de</strong>n WC, Razzak JA, Qureshi HI, Hy<strong>de</strong>r AA, Pappas G: Inci<strong>de</strong>nce,patterns and severity of reported unintentional injuries in Pakistan for personsfive years and ol<strong>de</strong>r: results of the National Health Survey of Pakistan 1990-94.BMC public health 2007, 7:152.5. Ahmed A: Road Safety in Pakistan. Islamabad: National Road Safety Secreteriat;2007.6. Raja IA, Vohra AH, Ahmed M: Neurotrauma in Pakistan. World journal of surgery2001, 25(9):1230-1237.7. Government of Pakistan: Pakistan Transport Plan Study in the Islamic RepublicOf Pakistan. Islamabad: tripartite collaboration of the Japan InternationalCooperation Agency (JICA); National Transport Research Centre (NTRC), andMinistry of Communications, Government of Pakistan; 2007.8. National Transport Research Centre: Traffic Counter measures in Pakistan.Islamabad: National Transport Research Centre, Ministry of Communication; 1985.9. Shah SG, Khoumbati K, Soomro B: The pattern of <strong>de</strong>aths in road traffic crashes inSindh, Pakistan. International journal of injury control and safety promotion 2007,14(4):231-239.10. Oxley J, Corben B, Koppel S, Fil<strong>de</strong>s B, Jacques N, Symmons M, Johnston I: Costeffectiveinfrastructure measures on rural roads. Clayton, Victoria: MonashUniversity Acci<strong>de</strong>nt Research Centre; 2004.11. Wootton J, Jacobs GD: Safe roads: A dream or a reality. Crowthorne: TransportResearch Laboratory; 1996.95
12. Pe<strong>de</strong>n M, Scurfiled R, Sleet D, Mohan D, Hy<strong>de</strong>r A, Jarawan E: World report onroad traffic injury prevention. Geneva: World Health Organization; 2004.13. WHO: Global status report on road safety. Geneva: World Health Organization(WHO); 2009.14. Razzak JA, Luby SP: Estimating <strong>de</strong>aths and injuries due to road traffic acci<strong>de</strong>ntsin Karachi, Pakistan, through the capture-recapture method. Internationaljournal of epi<strong>de</strong>miology 1998, 27(5):866-870.15. Jamison DT, Mosley WH, Measham AB, Bobadilla JL (Eds.): Disease ControlPriorities in Developing Countries. Washington, DC: Oxford University Press; 1993.16. JICA, NTRC, Government of Pakistan: Pakistan Transport Plan Study in theIslamic Republic Of Pakistan. Islamabad: tripartite collaboration of the JapanInternational Cooperation Agency (JICA); National Transport Research Centre(NTRC), and Ministry of Communications, Government of Pakistan; 2007.17. National Highway Authority (NHA): Traffic survey. Islamabad: NHA; 2008.18. Government of Pakistan: Pakistan Economic Survey 2008-09. Islamabad: EconomicAdvisor's Wing, Finance Division, Government of Pakistan; 2009.19. Nishtar S, Mohamud KB, Razzak J, Ghaffar A, Ahmed A, Khan SA, Mirza YA:Injury prevention and control: National Action Plan for NCD Prevention,Control and Health Promotion in Pakistan. Jpma 2004, 54(12 Suppl 3):S57-68.20. Khoso A: Analysis of National Highways & Motorway Police Injury SurveillanceSystem with respect to WHO Injury Surveillance Gui<strong>de</strong>lines. KerolinskaInstitutet, Department of Public Health Sciences; 2007.21. Razzak JA, Luby SP, Laflamme L, Chotani H: Injuries among children in Karachi,Pakistan--what, where and how. Public health 2004, 118(2):114-120.22. Wikipedia: Edhi Foundation. . San Francisco, CA: Wikimedia Foundation Inc.; 2010.[Available at URL: http://en.wikipedia.org/wiki/Edhi_Foundation] [Cited July 9,2010].23. Raftery KA: Emergency medicine in southern Pakistan. Annals of emergencymedicine 1996, 27(1):79-83.24. Road Injury Research and Prevention Centre: Report of road injury surveillanceproject of the road injury research and prevention centre of JPMC, Karachi.Karachi: Jinnah Post Graduate Medical Centre (JPMC); 2008.25. Ahmed A: National Road Safety Plan 2007-2012. Islamabad: National Road SafetySecretariat, Ministry of Communications; 2007.26. Stevenson M, Segui-Gomez M, Lescohier I, Di Scala C, McDonald-Smith G: Anoverview of the injury severity score and the new injury severity score. Inj Prev2001, 7(1):10-13.27. Amoros E, Martin JL, Laumon B: Estimating non-fatal road casualties in a largeFrench county, using the capture-recapture method. Acci<strong>de</strong>nt; analysis andprevention 2007, 39(3):483-490.28. NHA: Traffic survey. Islamabad: National Highway Authority (NHA); 2008.29. Lagar<strong>de</strong> E: Road traffic injury is an escalating bur<strong>de</strong>n in Africa and <strong>de</strong>servesproportionate research efforts. PLoS medicine 2007, 4(6):e170.30. Evans L: Traffic Safety. Bloomfield Hills, MI: Science Serving Society; 2004.31. Suddle MS: Police-Executive Relationship in Pakistan In Police Reform in SouthAsia: Sharing of Experiences. New Dehli: Commonwealth Human Rights Initiative(CHRI); 2007.32. Razzak JA, Cone DC, Rehmani R: Emergency medical services and cultural<strong>de</strong>terminants of an emergency in Karachi, Pakistan. Prehosp Emerg Care 2001,5(3):312-316.96
33. Mohan D: Road safety in less-motorized environments: future concerns.International journal of epi<strong>de</strong>miology 2002, 31(3):527-532.34. Razzak JA, Laflamme L: Limitations of secondary data sets for road traffic injuryepi<strong>de</strong>miology: a study from Karachi, Pakistan. Prehosp Emerg Care 2005,9(3):355-360.35. Observatoire National Interministériel <strong>de</strong> Sécurité Routière: La sécurité routière enFrance: Bilan <strong>de</strong> l'année 2004. Paris: La documentation Française; 2005.36. MacKay JM, Macpherson AK, Pike I, Vincenten J, McClure R: Action indicators forinjury prevention. Inj Prev, 16(3):204-207.97
Table 1. Traffic injuries reported to police, ambulance, and emergency <strong>de</strong>partment onKarachi-Hala road section (2008).PoliceAmbulanceEmergency<strong>de</strong>partmentN % N % N %Road traffic crash- Fatal 19 44.1 37 14.5 47 10.4- Not fatal 24 55.8 184 72.2 372 82.9- Unknown 0 0.0 34 13.3 30 6.7Road traffic injury- Deaths 27 18.8 55 10.4 60 9.1- Transported to hospital 80 55.9 428 80.6 601 90.9- Not transported to hospital 36 25.2 48 9.0 NAName of patient available- Yes 96 67.1 414 78.0 648 98.0- No 47 32.9 117 22.0 13 2.0Age (y)- 0-15 14 9.8 34 6.4 62 9.4- 16-45 88 61.5 292 55.0 516 78.1- >45 4 2.8 33 6.2 78 11.8- Unknown 37 25.9 172 32.4 5 0.7Sex- Male 93 65.0 364 68.5 609 92.1- Female 12 8.4 78 14.7 52 7.9- Unknown 38 26.6 89 16.8 0 0.0Road user group- Pe<strong>de</strong>strian 5 3.5 40 7.5 83 12.7- Motorcycle ri<strong>de</strong>rs 6 4.2 49 9.2 203 30.6- Four-wheeled vehicles’ occupants 120 83.9 403 75.9 327 49.5- Others 0 0.0 1 0.2 4 0.6- Unknown 12 8.4 38 7.2 44 6.6NA – Not applicable98
Table 2. Differences in outcome of traffic injury for matched patients (N=108) i<strong>de</strong>ntified inpolice, ambulance, and emergency <strong>de</strong>partment records for Karachi-Hala road section, 2008PoliceAmbulanceAmbulanceHospitalInjured Died Discharged Admitted DiedN (%) N (%) N (%) N (%) N (%)Injured 13 46.4 4 14.3 6 42.9 1 7.1 1 7.1Died 0 0.0 11 39.3 0 0.0 0 0.0 6 42.9Injured 49 53.3 26 28.3 9 9.7Died 0 0.0 0 0.0 8 8.799
Table 3. Ascertainment of police, ambulance, and emergency <strong>de</strong>partment records for trafficfatalities and injuries on Karachi-Hala road section (N=1 214)Outcome Police Ambulance Hospital Total Rate †N %* N %* N %* N %Deaths 27 22.6 55 46.2 60 50.4 119 9.8 54.4Injuries 116 10.6 476 43.5 601 54.9 1 095 91.2 500.4* Ascertainment rate; numbers of record divi<strong>de</strong>d by total for the given outcome.† per 10 9 km travelled.100
Figure 1. Unique records of traffic injury patients reported to police, ambulance service, an<strong>de</strong>mergency <strong>de</strong>partments on Karachi-Hala road section in 2008 (N=1 214)PoliceN=14311415 113AmbulanceN=531424 56879HospitalN=661101
Appendix 5: Article published – Study III102
103
104
105
106
107
108
109
Appendix 6: Article un<strong>de</strong>r review – Study IVNote: Revisions are un<strong>de</strong>rlined.TITLEBur<strong>de</strong>n and factors associated with highway work-zone crashes, Karachi-Hala road section,PakistanAUTHORS1. Junaid Ahmad BHATTI a,2. Junaid Abdul RAZZAK b3. Emmanuel LAGARDE a4. L.-Rachid SALMI a,c,dAFFILIATIONSa. Equipe Avenir « Prévention et Prise en Charge <strong>de</strong>s Traumatismes », Institut National <strong>de</strong> laSanté et <strong>de</strong> la Recherche Médicale Unité 897 (INSERM U897), Bor<strong>de</strong>aux, France.b. Department of Emergency Medicine, The Aga Khan University, Karachi, Pakistan.c. Institut <strong>de</strong> Santé Publique, d’Epidémiologie et <strong>de</strong> Développement (<strong>ISPED</strong>), UniversitéVictor Segalen Bor<strong>de</strong>aux 2, Bor<strong>de</strong>aux, France.d. Service d’information médicale, Centre Hospitalier Universitaire <strong>de</strong> Bor<strong>de</strong>aux, Bor<strong>de</strong>aux,France.CORRESPONDING AUTHORJunaid A. BHATTIEquipe Avenir « Prévention et Prise en Charge <strong>de</strong>s Traumatismes »Institut National <strong>de</strong> la Santé et <strong>de</strong> la Recherche Médicale Unité 897 (INSERM U897)146 rue Léo Saignât33076 Bor<strong>de</strong>aux ce<strong>de</strong>xFranceTel: +(33) 5 57 57 45 50Fax: +(33) 5 57 57 45 28Email: junaid.bhatti@yahoo.comCOUNTSAbstract: 178 wordsManuscript: 2 317 wordsReferences: 28Tables: 3Figure: 1110
ABSTRACTObjective: To assess the bur<strong>de</strong>n and factors associated with highway work-zone (HWZ)crashes.Design: Historical cohort.Setting: Karachi-Hala road-section, Pakistan (196 km).Data: Police reported crashes and traffic statistics from Jan 06 to Dec 08.Analysis: Crash and fatality risk between HWZ and other zones for a 50-km-long sectionwere compared. Crash locations were <strong>de</strong>scribed for a further 146-km-long section on whichfactors associated with HWZ crashes were assessed.Results: HWZs accounted for 15.0% of traffic crashes (N=180) and 30.8% of road fatalities(N=91) on the 196-km-long section. Rates were higher in HWZ compared to other zones forcrash (rate ratio (RR) = 2.35, 95% confi<strong>de</strong>nce interval (95%CI) = 1.17-4.70) and fatality (RR= 4.70, 95%CI = 2.11-10.46). Opposite-direction (adjusted odds ratio (aOR)=10.65, 95%CI=3.22-35.25) and traffic crashes involving pe<strong>de</strong>strians (aOR=6.03, 95%CI=1.39-26.20) andon wet surfaces (aOR=7.26, 95%CI=4.15-48.89) were significantly associated with HWZs.Conclusion: These results orient toward prevention measures such as strict trafficenforcement, traffic separation, improving pe<strong>de</strong>strians’ conspicuity, and hazard signage atHWZs in Pakistan. Feasibility and effectiveness of these measures remains to be evaluated.Keywords: Developing country; road/traffic acci<strong>de</strong>nts; severity; trauma.Abbreviations: HWZ, highway work zones; km, kilometre; LMIC, low and middle-incomecountries; NHA, National Highway Authority; NHMP, National Highway & MotorwayPolice; PKR, Pakistani rupee; USA, United States of America.111
1. INTRODUCTIONWith the aging of highways, road authorities spend a consi<strong>de</strong>rable proportion of their budgeton maintenance. 1-3 For instance, fe<strong>de</strong>ral and state highway <strong>de</strong>partments of transportation inthe United States of America (USA) invest 10-15% of their annual budget on the maintenanceof highways, amounting to tens of billions of US$ each year. 4 5 Similarly, Low- and Middle-Income Countries (LMICs) spend a consi<strong>de</strong>rable portion of their <strong>de</strong>velopment assistance onhighway maintenance projects. 6 7 Construction zones, often named Highway Work Zones(HWZ), are present on all road networks anywhere in the world. 1-7HWZs are different from work zones in urban areas, because provision of <strong>de</strong>tours is oftenimpractical. 1 2 Thus regular traffic flows need to be restricted, leading to safety challenges. 8Previous research in <strong>de</strong>veloped countries has <strong>de</strong>monstrated an increased crash and fatality riskin HWZ as compared to other parts of the transport network. 9 For instance, in two-lanehighways of Kansas, 63% of fatal crashes and one-third of injury crashes took place onHWZs. 10 The estimated cost of HWZ crashes between 1995 and 1997 in the USA was 6.2billion US$ with an average cost of 3,687 US$ per crash. 11 Nevertheless, the safety problemrelated to HWZ has received some attention in high-income countries (HIC) and appropriatetraffic control interventions are implemented during the construction periods. 2Pakistan has a strategic national highway network of over 8 000 km. Over 90% of the inlandtraffic passes through these road sections and, consequently, these highways un<strong>de</strong>rgoextensive wear and tear due to overloading, heavy traffic, and <strong>de</strong>layed maintenance. 12-14Previous research has shown that 27% of road fatalities occurred on these roads although thatthey accounted for only 4% of the network. 14 A survey conducted in 2000 showed that 50%of the national highway network was in need of major pavement reconstruction. 12 15 Themaintenance <strong>de</strong>mand had consistently increased from 10 billion Pakistani rupees (PKR) in1991 to over 30 billion PKR in 2005, yet only around 10 billion PKR were available in 2005for highway maintenance. 12 To date, no study has ever estimated the road crash bur<strong>de</strong>n due tosuch traffic conditions in Pakistan. 13 16 The objective of this study was to assess the bur<strong>de</strong>nand factors associated with HWZ crashes on an interurban highway in Pakistan.2. METHODS2.1 Study <strong>de</strong>sign and settingAs we compared the inci<strong>de</strong>nce <strong>de</strong>nsity rates, estimated from events (crash, fatality, or injury)and person-time exposure (km travelled) measures, between the HWZ and normal trafficzones, the study <strong>de</strong>sign was similar to an historical cohort study. 17 18 The study setting was a196-km-long four-lane, separated, non-access controlled Karachi-Hala road section in theprovince of Sindh, Pakistan. Traffic counts ranged from 16,356 vehicles per day onHy<strong>de</strong>rabad–Hala sub section (50 km) to 24,707 vehicles per day on Karachi-Hy<strong>de</strong>rabad subsection (146 km). 19 The National Highway Authority (NHA) manages the overallmaintenance and upgra<strong>de</strong> of this road section, mostly by private contractors. 12 The NationalHighway and Motorway Police (NHMP) have been enforcing traffic rules on this road sectionsince 2004.2.2 Traffic dataAnnual average daily traffic survey data were collected from NHA headquarters. Thesesurveys are conducted each year to assess traffic counts on different road sections un<strong>de</strong>r theFe<strong>de</strong>ral administration. 19 Locations near toll plazas are selected to assess 24-hour counts bythe NHA personals. We extracted information on traffic counts observed between Karachi-Hy<strong>de</strong>rabad (146 km) and Hy<strong>de</strong>rabad-Hala (50 km) road sections. Variables co<strong>de</strong>d from traffic112
surveys inclu<strong>de</strong>d number, type (trucks, buses transporting ≥ 20 passengers, mini-truck,minibus or coasters transporting < 20 passengers, cars or jeeps, and motorcycles), anddirection of vehicle (North-bound or South-bound). 19In Pakistan, during maintenance works on separated highways, two or more lanes in a givendirection are completely blocked and traffic is diverted, most of the times, to the oppositedirected lanes (figure 1A & 1B). The police and highway authorities facilitate traffic duringthe construction period. Detail of HWZ commencement and completion dates and kmlocations of maintenance works are recor<strong>de</strong>d in their memos. We collected this data fromNHA and NHMP regional offices, but these records were available only for the 50-km-longHy<strong>de</strong>rabad-Hala sub section.2.3 Crash dataAfter a crash, NHMP patrolling officer files the <strong>de</strong>tails of crash on a standard four-pageacci<strong>de</strong>nt analysis report. 20 A copy of this report is kept in the regional office, whereas theoriginal is sent to the NHA headquarters. Moreover, the crash is recor<strong>de</strong>d on a separateacci<strong>de</strong>nt register in each regional office. 20 All police crash reports and registers for the periodfrom Jan 06 to Dec 08 were retrieved and photocopied from regional NHMP offices with thepermission of the officer in charge.Variables co<strong>de</strong>d from acci<strong>de</strong>nt registers inclu<strong>de</strong>d date, time, number and type of involvedvehicles, number of persons injured or who died in a reported crash, and whether the crashoccurred during maintenance works. Variables co<strong>de</strong>d from crash reports inclu<strong>de</strong>d date, time,location, direction of lane (North-bound or South-bound), light, weather, horizontal andvertical road profile, road surface and shoul<strong>de</strong>r condition, ongoing maintenance, and causeand type of crash. 21 Type of crash was <strong>de</strong>fined as single vehicle, same direction, oppositedirection, si<strong>de</strong>wise, pe<strong>de</strong>strian. When more than one type was i<strong>de</strong>ntified, crashes were co<strong>de</strong>das crash of the most vulnerable involved road user; the vulnerability <strong>de</strong>creasing or<strong>de</strong>r was:pe<strong>de</strong>strian; opposite directions; si<strong>de</strong>wise or at intersection; single vehicle; same direction. 21Information on number, injury severity, and type of road user involved (pe<strong>de</strong>strian, ri<strong>de</strong>rs oftwo-wheelers, or occupants of cars/jeeps, minibuses, buses, or trucks) were co<strong>de</strong>d separately.Severity was <strong>de</strong>fined as ‘severe’ when the involved person was transported to the hospital and‘fatal’ when the involved road user died at the crash scene or at hospital within the first 24hours following the event. 202.4 AnalysisInformation on crashes from registers and reports were linked to make a single file based oncrash location (km) and crash date, available for all crashes. Crashes, fatality, and severeinjury per 10 9 vehicle-km travelled for vehicle type and direction were computed using trafficcounts survey. Due to limited data on traffic exposition of work zones, these rates for workand normal traffic zone were computed using information on work zone dates and averagedaily traffic for the 50-km-long sub-section. Crash, fatality, and severe injury risks accordingto road directions, vehicle types and traffic conditions were compared using rate ratios with95% confi<strong>de</strong>nce intervals, rate differences, and attributable risk proportions whereappropriate. 17 22 Associations of factors with HWZs crashes were estimated from a multiplelogistic regression mo<strong>de</strong>l, including all variables weakly associated (P
A total of 180 crashes were i<strong>de</strong>ntified from the police registers. Overall 612 road users wereinjured in these crashes; 14.8% (N=91) died, and 55.3% (N=339) were severely injured. Theroad fatality rate on this highway, excluding HWZ crashes, was 13.0 per 10 9 vehicle-km(table 1). The crash rate was significantly higher in North-bound as compared to South-bounddirection (rate ratio (RR) = 1.81, 95% confi<strong>de</strong>nce interval (95%CI) = 1.30, 2.52). Comparedto trucks, the crash rate was lower for passenger cars (RR = 0.57, 95% CI = 0.42, 0.78), butthe fatality rate was twice as high for passenger cars compared to trucks (RR = 1.93, 95%CI =1.04, 3.61). Similarly, fatality rate was significantly higher for occupants of buses (RR = 3.32;95%CI = 1.52, 7.22) and minivans (RR = 4.75; 95%CI = 1.84, 12.24), as compared to trucks’occupants.3.2 Work zone related crash and injury bur<strong>de</strong>nFifteen percent (N=27) of the traffic crashes occurred in HWZs, accounting for 30.8% (N=28)of all fatalities and 15.3% (N=52) of those severely injured on the 196-km-long road section.During the three-year period, 0.89 billion vehicle-km travelled on the 50-km-long sub-sectionfor which HWZ dates were available. HWZ accounted for 17.6% of the vehicle km travelledon this sub section. On average, HWZs were 5.7-km-long (SD = 4.3). Two work zones were10 and 14-km-long and lasted more than 300 days. The crash (32.5 vs. 31.6 per 10 9 kmtravelled) and the fatality (16.3 vs. 13.0 per 10 9 km travelled) rates observed on normal trafficzone of this sub-section were similar to that for the whole road section whereas severe injuryrate (89.4 vs. 59.3 per 10 9 km travelled) was higher as compared to the whole road section.Significantly higher crash (RR = 2.35), fatality (RR = 4.70), and severe injury risks (RR =1.92) were observed on HWZs compared to other zones (P≤0.004) on this sub section (table2).3.3 Factors associated with HWZ crashesComplete reports were available for 93.3% (N=168) of all traffic crashes, 96.8% of fatalcrashes (N=63), and 98.9% of severe injury crashes (N=88). Crashes between vehiclesmoving in opposite direction and those involving pe<strong>de</strong>strians were more likely on HWZ thanon other sections (table 3). Similar associations were observed for both sub-sectionsseparately, where pe<strong>de</strong>strian and opposite direction crashes accounted for most (≥73.2%,P≤0.01) HWZ crashes. Similarly, wet surface crashes were significantly more likely to occuron HWZ than on non HWZ. However, this association was not observed when the two subsectionswere analyzed separately. Hazardous overtaking was the major cause of crash inHWZs (55.6%) whereas sud<strong>de</strong>n entry on the road was i<strong>de</strong>ntified as crash cause in all of thepe<strong>de</strong>strian involving HWZ crashes (N=5, 18.5%).4. DISCUSSIONThese results showed that HWZs lead to increased road crash and fatality risk on this nationalhighway in Pakistan. Overall, HWZs accounted for one third of fatalities and the crash fatalityrisk was four times higher in HWZs as compared to normal traffic. In HWZ, one out of twocrashes occurred between opposite-direction vehicles; the likely explanation of was the highvolume un-separated traffic conditions and hazardous overtaking.The highway traffic is expected to triple from 2005 to 2025 in Pakistan. 12 The Governmenthas envisaged meeting these <strong>de</strong>mands by upgrading and improving the current highwaynetwork, exposure to HWZs is thus expected to increase. 12 Although gui<strong>de</strong>lines for work zonemanagement exist in Pakistan, so far no mechanism for HWZ <strong>de</strong>sign, performance, an<strong>de</strong>nforcement evaluation has been <strong>de</strong>fined or implemented. 15 These results suggested the needto improve institutional capacity as well as inspection mechanisms so that road agencies114
should be accountable for ensuring HWZ safety. 2 12 15 Further, reducing HWZ duration couldbe useful in <strong>de</strong>creasing the resulting crash risk. 15Almost half of the traffic on the highway was composed of heavy trucks which have anoverall low speed. 12 As the space to accommodate the traffic volume is reduced in HWZ, it islikely that in absence of harsher penalties and barriers, smaller and faster vehicles performedhazardous overtaking. Our results consistently showed that most of the crashes occurred as aresult of traffic conflict between the oppositely moving traffic in the work zones (figure 1B). 21This points out the need to carefully plan and regulate the traffic flow during maintenanceworks. Enforcing harsher penalties for overtaking, providing alternate lanes, and trafficseparation might be some of the useful measures to <strong>de</strong>crease hazardous situations leading toHWZs crashes in Pakistan. 15This study showed that pe<strong>de</strong>strians, probably including workers, were significantly involvedin HWZ crashes. Sud<strong>de</strong>n entry onto the highway was reported as the major cause of suchcrashes. Similarly, wet surface increased the risk of HWZ crashes. Such involvements,although less important, were found in HWZ crashes elsewhere. 10 Human judgement error isin<strong>de</strong>ed one of the principal factor i<strong>de</strong>ntified in HWZ crashes. 1 10 These results indicated thatprevention measures such as advance warning area, clear zones to enhance visibility, roadmarkings, hazard signage in the work area, and conspicuity equipment for workers could beuseful to reduce such crashes in Pakistan. 3 15Finally, the overall traffic fatality risk on this highway is several times higher as compared toa limited access road in the HICs. 24 Factors such as drowsiness, speeding, hazardousovertaking, and poor vehicle condition were highly involved in these crashes. 25 26 Theseresults were not surprising as the traffic conditions are quite different from HICs which hadmore crash prevention and control measures on their roads. 21 Interestingly, the fatality risk forthe occupants of cars, minibuses, and buses were two times or more high than for thosetravelling in trucks. The higher fatality risk associated with car and bus occupants ascompared to truck occupants could be due to the high number of passengers and the non useof seat belts by both drivers and passengers, substandard vehicles, and higher traffic speeds. 26This study <strong>de</strong>monstrates the need to investigate and control high vulnerability of caroccupants in LMICs.This study may have some limitations. Firstly, we inclu<strong>de</strong>d only police reported crashes,which were shown to report only 56% of road fatalities and 4% of severe injuries inPakistan. 27 Thus given results could un<strong>de</strong>r estimate the crash risk which we had assumed to besame for both the HWZ and normal traffic zones. Further, traffic measuring was based on 24-hour surveys. This could lead to both un<strong>de</strong>restimation and overestimation of the crash risk. 17Nevertheless, these had been used previously to compare the crash risk for vehicles and roadtypes in LMICs. 21 Finally, little information was available on involved drivers to account forthose factors in adjusted analyses. 1Pakistan, like many other LMICs, is passing through economic transition. 12 With the expectedincrease in HWZ activity in the future, several lessons could be learnt from this study. Firstly,a high road injury bur<strong>de</strong>n in HWZ indicated that a monitoring system is nee<strong>de</strong>d to examinethe HWZ safety measures by the agencies involved in maintenance works. 15 Secondly, moreefforts are required to reduce the duration of HWZs. 2 Finally, these results orient towardprevention measures such as harsher punishment for traffic violations such as overtaking,traffic separation, advanced warning area, hazard signage, and improving pe<strong>de</strong>strians’115
conspicuity at HWZs in Pakistan. 2 8 15 Feasibility and effectiveness of their implementation,however remains to be evaluated.ACKNOWLEDGEMENTSWe are especially thankful to Dr. Aftab Ahmed PATHAN, Deputy Inspector General ofPolice, Mr. Irshad SODHAR, Senior Patrolling Officer, and Mr. Naeemullah SHIEKH , SeniorPatrolling Officer, National Highway and Motorway Police south sector III office, Pakistanfor their support in data collection. Authors also acknowledge Engr. Ali Bin Usman SHAH,Road Safety Expert at National Highway Authority for providing traffic survey reports.Finally, we would like to thank the editor and reviewers for their suggestions to improve thecontent of this manuscript.FUNDINGFirst author is the PhD candidate at Université Victor Segalen Bor<strong>de</strong>aux 2. This position isfun<strong>de</strong>d by Higher Education Commission of Pakistan. Institut National <strong>de</strong> la Santé et <strong>de</strong> laRecherche Médicale Unité 897, France, fun<strong>de</strong>d the logistics for data collection. Fundingbodies had no input in study <strong>de</strong>sign, analysis and interpretation of results.AUTHORS CONTRIBUTIONThis study is the part of PhD thesis work of JB supervised by LRS. JAR and EL provi<strong>de</strong>dtechnical help in study conception, <strong>de</strong>sign, analysis, and manuscript writing.COMPETING INTERESTSNo competing interests were i<strong>de</strong>ntified for any of the authors.LICENSE STATEMENT:The Corresponding Author has the right to grant on behalf of all authors and does grant onbehalf of all authors, an exclusive licence (or non exclusive for government employees) on aworldwi<strong>de</strong> basis to the BMJ Publishing Group Ltd and its licencees, to permit this article (ifaccepted) to be published in IP and any other BMJ Group products and to exploit allsubsidiary rights, as set out in our licence (http://ip.bmjjournals.com//ifora/licence.pdf).Important pointsWhat is already known on the subject?• Highway work zones (HWZs) lead to increased crash and fatality risk.• Risks and factors associated with such zones were rarely studied in <strong>de</strong>veloping countries.What this study adds:• Crash fatality risk was four times as high on HWZs as compared to other zones in Pakistan, alow-income country.• Traffic separation, harsher penalties for hazardous overtaking, and appropriate hazard signageat HWZs might reduce the risk of such crashes.Policy implications:• Exposition to HWZ will tremendously increase in coming years in <strong>de</strong>veloping countries likePakistan. Implementation of safety interventions at HWZs may significantly reduce roaddisease bur<strong>de</strong>n.REFERENCES1. Li Y, Bai Y. Highway work zone factors and their impact on crash severity. J Transp Eng2009;135:694-701.116
2. American Association of State Highway and Transportation Officials (AASHTO). Apolicy on geometric <strong>de</strong>sign of highways and streets. Washington, DC: AASHTO,2004.3. Li Y, Bai Y. Development of crash-severity-in<strong>de</strong>x mo<strong>de</strong>ls for the measurement of workzone risk levels. Accid Anal Prev 2008;40:1724-31.4. Department of Transportation (DOT). FY 2008 Budget in brief. Washington, DC: DOT,2008.5. Department of Transportation (DOT). Highway Statistics 2007: Funding For Highwaysand Disposition of Highway-User Revenues, All Units of Government, 2007.Washington, DC: DOT, 2007.6. Republic of Ghana, European Community. Country Strategy Paper and IndicativeProgramme for the period 2002–2007. Accra: European Union <strong>de</strong>legation in Ghana,2002.7. Masood H, Seetharam KC, Utami D, et al. Report and recommendation of the Presi<strong>de</strong>nt tothe board of directors on proposed loans to the Islamic Republic of Pakistan for theNorth-West Frontier Province road <strong>de</strong>velopment sector and subregional connectivityproject. Manilla: Asian Development Bank, 2004.8. American Association of State Highway and Transportation Officials (AASHTO).Summary report on work zone crashes. Standing committee on highway traffic safety.Washington, DC: AASHTO, 1987.9. Wang J, Hughes WE, Council FM, at al. Investigation of highway work zone crashes:what we know and what we do not know. J Transp Res Rec 1996;(1529):54-64.10. Li Y, Bai Y. Comparison of characterstics between fatal and injury acci<strong>de</strong>nts in highwaywork zones. Safety Sci 2008;46:646-60.11. Mohan SB, Gautam P. Cost of highway work zone injuries. Practical Periodical onStructural Design and Construction 2002;7:68-73.12. JICA, NTRC, Government of Pakistan. Pakistan Transport Plan Study in the IslamicRepublic of Pakistan. Islamabad: tripartite collaboration of the Japan InternationalCooperation Agency (JICA); National Transport Research Centre (NTRC), andMinistry of Communications, Government of Pakistan, 2007.13. Nishtar S, Mohamud KB, Razzak J, et al. Injury prevention and control: National ActionPlan for NCD Prevention, Control and Health Promotion in Pakistan. J Pak MedAssoc 2004;54:S57-68.14. National Transport Research Centre. Traffic Counter measures in Pakistan: NTRCpublication 85. Islamabad: National Transport Research Centre, Ministry ofCommunication, 1985.15. Ahmed A. National Road Safety Plan 2007-2012. Islamabad: National Road SafetySecretariat, Ministry of Communications, 2007.16. Hy<strong>de</strong>r AA, Ghaffar AA, Sugerman DE, et al. Health and road transport in Pakistan.Public Health 2006;120:132-41.17. Salmi LR, Battista RN. Epi<strong>de</strong>miologic assessment of hazardous roadway locations.Epi<strong>de</strong>miology 1990;1:311-4.18. Lassarre S. Some Statistical Mo<strong>de</strong>ls for Road Risk Analysis. In: Tiwari G, Mohan D,Muhlrad N, editors. The Way Forward: Transportation Planning and Road Safety.New Delhi: MacMillan India Ltd., 2005.19. National Highway Authority (NHA). Traffic survey. Islamabad: NHA, 2008.20. Khoso A. Analysis of National Highways & Motorway Police Injury Surveillance Systemwith respect to WHO Injury Surveillance Gui<strong>de</strong>lines. Stockholm; Kerolinska Institutet,2007.117
21. Sobngwi-Tambekou J, Bhatti J, Kounga G, et al. Road traffic crashes on the Yaoundé–Douala road section, Cameroon. Accid Anal Prev 2010;42:422-6.22. Rothman KJ, Greenland S, editors. Mo<strong>de</strong>rn Epi<strong>de</strong>miology. Second ed. Phila<strong>de</strong>lphia, PA:Lippincott Williams & Wilkins, 1998.23. Hosmer DW, Lemeshow S. Applied Logistic Regression. Second ed. Danvers, MA: JohnWiley & Sons, Inc., 2000.24. Observatoire National Interministériel <strong>de</strong> Sécurité Routière. La sécurité routière enFrance: Bilan <strong>de</strong> l'année 2004. Paris: La documentation Française, 2005.25. Ross A, Baguely C, Hills B, et al. Towards safer roads in <strong>de</strong>veloping countries.Crowthorne: Transport Research Laboratory, 1994.26. Tiwari G, Mohan D, Muhlrad N, editors. The Way Forward: Transportation Planningand Road Safety. Delhi: McMillan India Ltd, 2005.27. Pe<strong>de</strong>n M, Scurfiled R, Sleet D, et al (editors). World report on road traffic injuryprevention. Geneva: World Health Organization, 2004.118
Table 1. Road crash fatality and injury risk per 10 9 vehicle-km on the Karachi-Halaroad section, Pakistan (2006-08)Vehicle-km Crash Fatality Severe injury10 9 N Rate* N Rate* N Rate*All (except work zone) 4.84 153 31.61 63 13.02 287 59.30-North-bound direction 2.40 98 40.83 38 15.83 191 79.58-South-bound direction 2.44 55 22.54 25 10.25 96 39.34Vehicle †-Motorcycle 0.19 10 52.63 8 42.11 10 52.63-Car/jeep 1.90 60 31.58 29 15.26 107 56.32-Mini-van (
Table 2. Highway work zone crash fatality and injury risk per 10 9 vehicle-km onKarachi-Hala road sub-section, Pakistan (2006-08)Vehicle-km Crash Fatality Severe injury10 9 N Rate † N Rate † N Rate †Work zone 0.157 12 76.43 12 76.43 27 171.97Normal traffic 0.738 24 32.52 12 16.26 66 89.43Rate ratio (RR) 2.35 4.70 1.9295% Confi<strong>de</strong>nce Interval for RR 1.17; 4.70 2.11; 10.46 1.23; 3.01Rate difference 43.91 60.17 82.54Attributable proportion (%) 57.45 78.73 48.00† Per 10 9 vehicle-km120
Table 3. Factors associated with work-zone crashes on 196-km-long Karachi-Halaroad section, Pakistan (2006-08)Work-zone crashes Other crashes P Adjusted 95%CI †N=27 N=141 Odds ratioN (%) N (%)Severity 0.003- Mild or no injury 0 0.0 20 14.2- Severe injury 10 37.0 77 54.6- Fatal 17 63.0 44 31.2Crash type- Same direction 4 14.8 67 47.5 1- Opposite/si<strong>de</strong>wise 17 63.0 25 17.7
122
Appendix 7: Manuscript in preparation – Study VTITLEHAZARD PERCEPTION AT HIGH- AND LOW-RISK ROAD SITESAUTHORS1/ Junaid Ahmad BHATTI, MSc a,b,*2/ Junaid Abdul RAZZAK, MD, PhD c3/ Emmanuel LAGARDE, PhD a,b4/ Jöelle SOBNGWI-TAMBEKOU, MD a5/ Ahmadou ALIOUM, PhD a6/ L.-Rachid SALMI, MD, PhD a,b,d,*AFFILIATIONSa. Institut National <strong>de</strong> la Santé et <strong>de</strong> la Recherche Médicale Unité 897 (INSERM U897),Bor<strong>de</strong>aux, Franceb. Institut <strong>de</strong> Santé Publique, d’Epidémiologie <strong>de</strong> Développement (<strong>ISPED</strong>), Université VictorSegalen Bor<strong>de</strong>aux 2, Bor<strong>de</strong>aux, France.c. Department of Emergency Medicine, The Aga Khan University, Karachi, Pakistan.d. Service d’information médicale, Centre Hospitalier Universitaire <strong>de</strong> Bor<strong>de</strong>aux, Bor<strong>de</strong>aux,France.* Contributed equallyCORRESPONDING AUTHORJunaid A. BHATTIEquipe Avenir « Prévention et Prise en Charge <strong>de</strong>s Traumatismes »Institut National <strong>de</strong> la Santé et <strong>de</strong> la Recherche Médicale Unité 897 (INSERM U897)146 rue Léo Saignat33076 Bor<strong>de</strong>aux ce<strong>de</strong>xFranceTel: +(33) 5 57 57 45 50Fax: +(33) 5 57 57 45 28Email: junaid.bhatti@yahoo.comCOUNTSAbstract: 244Manuscript: 3 165References: 44Tables: 4Figures: 0RUNNING TITLEHazard perception of crash sites123
ABSTRACTObjectives: Interurban roads contribute significantly to traffic fatalities in <strong>de</strong>velopingcountries. In this study, hazard perception was compared for sites frequently involved in RoadTraffic Crashes (RTCs) to those not involved in RTCs on the same road sections.Design: Study settings were Karachi-Hala road in Pakistan and Yaoundé-Douala road sectionin Cameroon. Vi<strong>de</strong>os of 26 high-risk sites (involved in ≥ 3 crashes in 3 years) and 26 low-risksites (no crash reported), matched for the road section, were shown to 100 voluntary Pakistanidrivers.Main outcome measures: Variations in perceived site hazardousness (Likert scale) andpreferred speed for each site pair were assessed. Factors associated with hazard perceptionlevel of high-risk sites were assessed using logistic regression analyses.Results: The drivers reported a higher hazard perception and a lower preferred speed forhigh-risk sites than for their matched low-risk sites in only half of pairs (N=12, P≤0.02).High-risk sites situated in built-up areas (adjusted odds ratio [OR] =0.58, 95% confi<strong>de</strong>nceinterval [95%CI] =0.51-0.68) and with lane width ≤ 8 m (OR=0.51, 95%CI=0.43-0.61) wereperceived less hazardous than low-risk sites with same road situation. Further, high-risk siteswith vertical road signs (OR=2.75, 95%CI=2.38-3.16) and U-turns (OR=8.00, 95%CI=6.36-10.22) were perceived more hazardous than low-risk sites with same situation.Conclusion: These methods i<strong>de</strong>ntified factors influencing the hazard perception of high-risksites on two road sections in <strong>de</strong>veloping countries. They might be useful in prioritizing highrisksites for improvement as well as implementing low-cost interventions in such settings.Keywords: Black spots; <strong>de</strong>veloping countries; epi<strong>de</strong>miology; risk factors; road trafficacci<strong>de</strong>nts.124
INTRODUCTIONRoad traffic safety is an important health problem worldwi<strong>de</strong>, resulting in anestimated 1.2 million <strong>de</strong>aths and another 50 million injuries each year (World HealthOrganization, 2009). Over 85% of these Road Traffic Crashes (RTCs) related <strong>de</strong>aths occur inLow- and Middle-Income Countries (LMICs) (Pe<strong>de</strong>n et al., 2004). Highways, which represent5 to 10% of national road networks, lead to significant injury bur<strong>de</strong>n in these countries. Forinstance in Pakistan, 27% of all police-reported fatal RTCs occur on National highway-5 (N5)(National Transport Research Centre, 1985). Similarly, on Yaoundé-Douala road-section inCameroon, approximately 73 <strong>de</strong>aths occurred per 100 million kilometer travelled, a rate 35times higher than on similar type of roads in Europe (Sobngwi-Tambekou, Bhatti, Kounga,Salmi, & Lagar<strong>de</strong>, 2010).RTCs are unevenly distributed along the network (Pe<strong>de</strong>n et al., 2004). They occur inclusters at single sites, often called high-risk sites, along particular sections of the road(Geurts & Wets, 2003). They can be <strong>de</strong>fined as sites having a higher expected number ofcrashes than other similar sites (Elvik, 2008). Theoretically, inadaptability of driving behaviorto the local road and traffic hazards leads to crashes at these sites (Geurts & Wets, 2003). Ithas been documented that <strong>de</strong>sign improvement at these sites can result in significant<strong>de</strong>creases in crash risk (Ross, Bagunley, Hills, McDonald, & Silcock, 1991). However, thisremains an expensive option, and not all high-risk sites can be improved in a timely manner(Geurts, Wets, Brijs, Vanhoof, & Karlis, 2006).Hazard perception is the ability to i<strong>de</strong>ntify potential hazardous situations and takingnecessary actions to avoid them (Benda & Hoyos, 1983; SWOV, 2008). Driver-related factorssuch as age, sex, familiarity with road, driving experience, attitu<strong>de</strong>s, and self-assessment ofskills could influence this ability (DeJoy, 1989; Finn & Bragg, 1986; Harre, 2000; Mayhew,Simpson, & Pak, 2003; McKenna, Stanier, & Lewis, 1991; Trankle, Gelau, & Metker, 1990).Road elements such as sharp bends, <strong>de</strong>creased widths, and presence of lane markings couldincrease hazard perception (Gol<strong>de</strong>nbeld & van Schagen, 2007; Kanellaidis, Zervas, &Karagioules, 2000). Previous research has shown that augmenting hazard perception by drivertraining or by implementing appropriate road furniture could significantly reduce thelikelihood of RTCs (Deery, 1999; Rundmo & Iversen, 2004).Much work on high-risk crash sites stressed that i<strong>de</strong>ntifying these sites using statisticalmethods so that safety work could be prioritized (Montella, 2010). Interactions betweendriver- and site-related factors had not been investigated in <strong>de</strong>tail to prioritize such sites,particularly on interurban roads in LMICs (Sabey & Taylor, 1980). To our knowledge, thehypothesis that high-risk crash sites might not be perceived as dangerous by some drivers hasnot been tested (Geurts & Wets, 2003). Insight into how high-risk crash sites are perceived bydrivers could be useful in <strong>de</strong>veloping and implementing less expensive interventions,particularly in LMICs (Harre, 2000). The objective of this study was to compare hazardperceptions for sites involved in RTCs to those not involved in RTCs in voluntary drivers.Further, we assessed driver- and road- related factors associated with hazard perception level.METHODSStudy <strong>de</strong>sign and settingsThe study settings were interurban road sections situated in Cameroon and Pakistan:1/ Karachi-Hala road section in Pakistan (196-km-long mostly four lane separated road), and2/ Yaoundé-Douala road section in Cameroon (243-km-long mostly two-lane non-separated125
oad). A matched strategy was used to select sites. ‘High-risk sites’ were those involved inthree or more RTCs in a prece<strong>de</strong>nt three-year period, whereas ‘low-risk sites’ were those notinvolved in a RTC, during the same period. For each high-risk site, a low-risk site wasrandomly selected on the same road section. Hazard perception was assessed by showingvi<strong>de</strong>os of these sites to voluntary Pakistani drivers. Ethical approval of the study <strong>de</strong>sign wasobtained from the Aga Khan University (AKU) Ethics Research Committee in May 2009(Reference ERC/2009/1179).Site selectionIn Pakistan, National Highway & Motorway Police (NHMP) regional office wasvisited in June 2009. Crash reports and registers for the three-year period from Jan 1, 2006 toDec 12, 2008 were retrieved and photocopied. High-risk sites with given kilometer locationwere then i<strong>de</strong>ntified with Global Positioning System (GPS) coordinates with help of a policeofficer. Similarly, traffic police offices in Cameroon were visited and such sites weresubsequently i<strong>de</strong>ntified in June 2007 (Bhatti, Sobngwi-Tambekou, Lagar<strong>de</strong>, & Salmi). Thetwo road sections were filmed from a four-wheeled sedan car moving within the authorizedspeed limit (July 2009 in Pakistan and July 2007 in Cameroon). All high- and low-risk siteswere then i<strong>de</strong>ntified by linking GPS coordinates to the vi<strong>de</strong>os. For each high-risk site, a lowrisksite was randomly selected out of all sites on the same road section which were notinvolved in crashes.Vi<strong>de</strong>o setsTo measure hazard perception, vi<strong>de</strong>o of sites were cut so that each vi<strong>de</strong>o showed a500-meter-long road section during 30 seconds, including the last 100 m corresponding to thehigh- or low-risk site. Further, a yellow indicator blinked five times to help drivers i<strong>de</strong>ntifythe site for which they had to emit a judgment on hazard perception during vi<strong>de</strong>o projection.We <strong>de</strong>termined sample size to be 26 pairs of sites, assuming that 95% of the high-risk siteswould be i<strong>de</strong>ntified as dangerous and 80% of the low-risk sites as not dangerous with aprecision of 7.5 (Flahault, Cadilhac, & Thomas, 2005).Participant selectionParticipants were Pakistani nationals residing in Karachi, aged 18 years or more, witha valid driving permit, who had driven a motorized vehicle on the Karachi-Hala road sectionin the previous seven days. Random sampling was not possible because of heavy-traffic andhigher speed conditions on this road section (Hijar, Carrillo, Flores, Anaya, & Lopez, 2000).Thus, a convenience, but representative, sampling method was used to recruit 100 drivers. Forthis, we <strong>de</strong>termined the drivers’ sex and vehicular distribution by observing traffic from apilot study (N=5 496). It was observed that cars accounted for 39.1%, heavy trucks for 36.5%,minibuses and mini-trucks for 7.8%, buses for 9.6%, and motorcycles for 6.3% of the vehiclesentering Karachi. Distribution of cars and heavy vehicles was similar to that recor<strong>de</strong>d byhighway authority (NHA, 2008). Almost all drivers were men (99.9%). Based on thesefindings, personal vehicle male drivers were invited from a roadsi<strong>de</strong> gas station at start of thehighway near Karachi, and commercial vehicle drivers were invited from transport companyoffices at six different locations in Karachi.Data collectionFace-to-face interviews with drivers were conducted in Urdu language. These were<strong>de</strong>veloped from an English language questionnaire using back translation, in<strong>de</strong>pen<strong>de</strong>ntlinguistic verification, and testing on five drivers. Interviews were either conducted at the AgaKhan University (AKU) Campus or at the company offices in separate rooms. Driver-related126
variables inclu<strong>de</strong>d socio-<strong>de</strong>mographic variables (age, sex, marital status, education, an<strong>de</strong>mployment), whether driving permit was issued without practical test, frequency of reportedrisky driving behaviors (sleepy driving, cell phone use while driving, seat-belt use, traffictickets, driving while intoxicated during previous three months), and involvement in RTCduring previous year.Using 17-inch vi<strong>de</strong>o screens, five test vi<strong>de</strong>os (three from Pakistan and two fromCameroon) were shown to drivers before presenting selected sites. The or<strong>de</strong>r of sites wasrandomly drawn for each participant. To avoid confusion from right- and left-hand drivingpracticed in Cameroon and Pakistan, site vi<strong>de</strong>os from Cameroon followed those fromPakistan. For each vi<strong>de</strong>o shown, drivers were asked to report their perception of site andtraffic, on a four-level scale; 1/ Certainly safe, 2/ Probably safe, 3/ Probably dangerous,4/ Certainly dangerous. Further, they were asked to record their preferred speed (in km/h) foreach site.Each site was characterized by the main investigator, using <strong>de</strong>finitions used in ourprevious study conducted in Cameroon (Bhatti et al.). Site-related variables assessed werebuilt-up or rural area, horizontal and vertical road profile, road width, surface regularity, vergeslope, <strong>de</strong>pth at 10 m from the verge, location and type of nearby obstacles (within a roaddistance of 50 m in each direction), horizontal marking, vertical road signs, and presence ofan intersection or a U-turn. Traffic-related variables assessed were traffic moving in same oropposite direction, visible pe<strong>de</strong>strian, motorcyclist, or heavy vehicle, rain or wet surface,maneuvering vehicle (crossing or overtaking), and number of lanes (Sümer, Ünal, Birdal,Çinar, & Çevikoglu, 2007).AnalysisProportions of site- and driver-related characteristics were computed. Discordance (D)of appreciation for a matched high- and low-risk site pair was <strong>de</strong>fined as “minor” whendifference of hazard perception level was one on the Likert scale and “major” when the leveldifference was more than one. Positive sign (D + ) was used to show that hazard perceptionlevel was higher for the high-risk site than its matched low-risk site, and negative sign (D - ) toshow that hazard perception level was lower for high-risk site than its matched low-risk site.Wilcoxon test was used to assess whether these discordances were significantly higher orlower for high-risk site than low-risk site. Similarly, differences in reported speeds formatched high- and low-risk site pairs were compared using a paired t test. Correlationsbetween reported speeds for high- and low-risk site pairs were assessed by intra-classcorrelation coefficient (ICC).Associations of driver-, site-, and traffic-factors with road hazard perception levelwere assessed using logistic regression (mo<strong>de</strong>l 1) with a backward selection strategyincluding significant (P
SitesOut of 131 crash sites i<strong>de</strong>ntified in Pakistan, 16 were involved in three or morecrashes. Similarly, out of 474 crash sites i<strong>de</strong>ntified in Cameroon, 18 were involved in three ormore crashes. We randomly selected 10 high-risk sites. In Pakistan, most high-risk sites werewith straight road profile (87%), whereas this proportion was 20% in Cameroon (Table 1).Road surface conditions were irregular on most high-risk sites in Pakistan (75% vs. 65%) andCameroon (90% vs. 40%) than low-risk sites. Half of high-risk sites in Pakistan (62%) andCameroon (50%) were with flat road profile. A vertical road sign was visible at 38% of highrisksites in Pakistan and at 40% in Cameroon. Fewer high-risk sites were located in built-uparea in Pakistan (31%) than in Cameroon (50%). Similarly, one third of high-risk sites were atintersection in Pakistan (31%) and Cameroon (40%). In Pakistan, 19% of the high-risk siteswere situated at a U-turn and on 13%, maintenance works was ongoing.ParticipantsOut of 100 participants, 44 were interviewed at the AKU. Most participants wereaged between 26-45 years and one fifth had received no education (Table 2). While all driverslived in Karachi, 46 of them had a resi<strong>de</strong>nce in other regions of Pakistan as well. Seventy fourdrivers reported either not wearing a seat-belt at all or wearing it occasionally, and 92 of themreported using a cell phone while driving. No significant association was found for any of thedriver-related factor or interview location with recent crash history.Hazard perception of high- and low-risk sitesIn twelve site pairs, five from Pakistan and seven from Cameroon, site hazardperception level was significantly higher and reported speeds were significantly lower forhigh-risk than for low-risk sites (Table 3). Correlations of pair-wise reported speeds weremo<strong>de</strong>rate to high (0.51≥ICC≤0.95). The highest negative speed differences (> 25 km/h) wereobserved for pair 4 (toll plaza at high-risk site), 16 (built-up area with markets and traffic athigh-risk site), and 24 (a curve, with rain, oil tanker, and parked vehicle on high-risk site).Most high-risk sites where site hazard perception was not different or lower than low-risksites were straight (N=10) and plain (N=8).Factors associated with hazard perceptionCompared to middle-aged drivers, significantly high hazard perception was reportedby drivers aged 18-25 years and those aged 26-35 years (Table 4). Similarly, compared toheavy trucks, those driving cars or mini-trucks reported significantly lower hazard perception.Vehicle driven remained significantly associated with hazard perception in mo<strong>de</strong>ls 2 and 3.The association of age with hazard perception was not significant in mo<strong>de</strong>l 3 (P > 0.05).Hazard perception of Cameroonian sites was higher than Pakistani sites. Similarlyhazard perception at sites with irregular surface conditions, at intersections, and with ongoingmaintenance works was significantly higher than those without them. Hazard perception ofsites with straight and flat road profile was significantly lower than those with curve and sloperoad profile. Hazard perception of high-risk sites in built-up areas and having road width≤ 8 m was significantly lower than low-risk sites with same features. Hazard perception ofhigh-risk sites with visible hazard sign or a U-turn was significantly higher than low-risk siteswith same features. Hazard perception of sites vi<strong>de</strong>os with maneuvering or oppositely movingvehicles was higher than site vi<strong>de</strong>os without them. Hazard perception of site vi<strong>de</strong>os withheavy vehicle or motorcycles was significantly lower than site vi<strong>de</strong>os without them. Hazard128
perception for high risk site vi<strong>de</strong>os with rain was significantly lower than low risk site vi<strong>de</strong>oswith same conditions.DISCUSSIONThis study showed that drivers were able to discriminate only half of high-risk sitesfrom their matched low-risk sites. Further analysis showed that certain driver-, road-, andtraffic-related characteristics were associated with a low hazard perception. For instance,participants who drove cars and mini-trucks had overall low hazard perception as compared tothose driving trucks. Similarly, hazard perception of sites with flat and straight road profilewas significantly lower than those without these profiles. Furthermore, high-risk crash sitessituated in built-up area, with lane width ≤ 8 m, and during rainy conditions were perceivedless hazardous than low-risk sites with same features.The study methods were inspired from diagnostic test studies, to assess the accuracyof drivers in differentiating high-risk sites from the low-risk ones (Flahault et al., 2005), andto analyze factors associated with low hazard perception. This study, for instance, showed thathazard perception of high-risk crash sites generally remained low, particularly for those siteswhich were straight and flat. Confronting these findings with the fact, previously shown onYaoundé-Douala road section, that crashes were significantly higher for a road section withflat profile (Bhatti et al.); this study suggested that drivers preferred higher traffic speeds atflat road sites (Afukaar, 2003; Damsere-Derry, Afukaar, Donkor, & Mock, 2008). Suchinformation could be extremely useful for safety experts, and these methods might facilitateprioritizing and providing insights into possible interventions at high-risk sites (Bishai,Asiimwe, Abbas, Hy<strong>de</strong>r, & Bazeyo, 2008).Furthermore, these methods assessed the odds of poor hazard perception of high-riskcompared to low-risk sites with same road features. For instance, the high-risk sites situated inbuilt-up areas were not perceived hazardous compared to low-risk sites with similar roadcharacteristics. In<strong>de</strong>ed, the inci<strong>de</strong>nce of RTCs on interurban road sections is higher in LMICsthan in <strong>de</strong>veloped countries (Mohan, 2002). Ribbon <strong>de</strong>velopment, improper crossingfacilities, higher traffic mix, and absence of service lanes in LMICs could explain this crashrisk in built-up areas (Ross et al., 1991). Our results suggested that implementinginterventions which increase hazard perception might reduce crash risk on such sites (Bhattiet al.).Moreover, narrow lane widths increased road hazard perception and reduced trafficspeed except for high-risk sites. It is likely that drivers were unable to perceive thehazardousness of such sites, because of little road furniture and hazard signage regardingspeed adjustments, a condition frequent in LMICs (Mohan, 2002; Ross et al., 1991). This wasconsistent with the observation that high-risk sites with hazard signs resulted in higher hazardperception levels. This clearly indicated that proper installation and maintenance of such signscould have long-term road safety implications in LMICs (Milleville-Pennel, Hoc, & Jolly,2007).Previous studies have showed that adverse weather conditions significantly increasedinterurban RTC risk in LMIC (Hijar et al., 2000; Majdza<strong>de</strong>h, Khalagi, Naraghi, Motevalian,& Eshraghian, 2008). Our results showed that the ability to <strong>de</strong>tect hazardousness of high-risksites could be compromised during such weather conditions. Enforcing low traffic speeds andinstallation of real-time speed indications during such conditions could reduce crash risk onthese roads (Konstantopoulos, Chapman, & Crundall).129
Similarly, it was shown previously that drivers of lighter and more powerful vehicleswere over-involved in crashes (Bener et al., 2006). Traffic composition on highways even inLMICs is significantly different from the cities, and passengers of such vehicles account for amajority of traffic injuries (Sobngwi-Tambekou et al., 2010). Furthermore, a low seat-belt anda high cell phone use reflected the low hazard perception observed in those driving suchvehicles (Perneger & Smith, 1991). These results indicated that improving hazard awarenessby enforcement and road measures might be useful in reducing crash risk in relativelyvulnerable groups (Rosenbloom, Shahar, Elharar, & Danino, 2008).Lastly, the high hazard perception of Cameroonian sites compared to Pakistani sitescould be explained by several factors. Firstly, the traffic was separated in Pakistan comparedto non-separated in Cameroon. A higher hazard perception was observed for maintenancezones in Pakistan, where traffic was not separated (Lewis-Evans & Charlton, 2006; Morgan,Duley, & Hancock). Further, mountainous terrain, unfamiliarity with the road section, andright-hand drive could augment the hazard perception for Cameroonian sites among Pakistanidrivers (McKenna, Horswill, & Alexan<strong>de</strong>r, 2006; Sagberg & Bjornskau, 2006). Areproduction of this study with Cameroonian drivers might help to assess the impact offamiliarity on hazard perception (McKenna et al., 1991).The study may have several limitations. Firstly, police un<strong>de</strong>rreporting of crashesmight have resulted in a small sample size to select high-risk sites (World HealthOrganization, 2009). Secondly, selection of voluntary drivers could lead to a pru<strong>de</strong>nt driversample (Delhomme, 1991). Thirdly, drivers may respond higher hazard perception for sites inPakistan known to them as high-risk ones (Lewis-Evans & Charlton, 2006). These biasesmight lead to high hazard perception of high-risk sites.In conclusion, the study methods provi<strong>de</strong>d an opportunity to i<strong>de</strong>ntify high-risk siteswith poor hazard perception features (Milleville-Pennel et al., 2007). These results showedthat implementing cost effective interventions such as hazard signs at those sites could reducetraffic speeds (Rosenbloom et al., 2008). These methods could be useful to assess expectedimpact of such interventions at those sites (Milleville-Pennel et al., 2007). Furthermore, thesemight help in <strong>de</strong>veloping and implementing specific interventions adapted to local settings inHICs and LMICs (Jamison, Mosley, Measham, & Bobadilla, 1993). Feasibility of thesemethods however, remains to be assessed.ACKNOWLEDGEMENTSAuthors are especially thankful to Dr. Aftab Ahmed PATHAN (NHMP), Mr. IrshadSODHAR (NHMP), Mr. Naeemullah SHIEKH (NHMP), Mr. Javed SHAH (AKU), Dr.Sanaullah BASHIR (AKU), and Dr. Kiran EJAZ (AKU) for their support in data collection.Authors would like to thank all the drivers who participated in the hazard perception studyand the owners of transport agencies who provi<strong>de</strong>d us the space to conduct the interviews.FUNDINGFirst author is the PhD candidate at Université Victor Segalen Bor<strong>de</strong>aux 2. This position isfun<strong>de</strong>d by Higher Education Commission of Pakistan. Institut National <strong>de</strong> la Santé et <strong>de</strong> laRecherche Médicale Unité 897, France, fun<strong>de</strong>d the logistics for data collection. Fundingbodies had no input in study <strong>de</strong>sign, analysis and interpretation of results.REFERENCES130
Afukaar, F. K. (2003). Speed control in <strong>de</strong>veloping countries: issues, challenges andopportunities in reducing road traffic injuries. Inj Control Saf Promot, 10(1-2), 77-81.Benda, H. V., & Hoyos, C. G. (1983). Estimating hazards in traffic situations. Accid AnalPrev, 15(1), 1-9.Bener, A., Ghaffar, A., Azab, A., Sankaran-Kutty, M., Toth, F., & Lovasz, G. (2006). Theimpact of four-wheel drives on traffic disability and <strong>de</strong>aths compared to passenger cars. J CollPhysicians Surg Pak, 16(4), 257-260.Bhatti, J. A., Sobngwi-Tambekou, J., Lagar<strong>de</strong>, E., & Salmi, L. R. Situational factorsassociated with road traffic crashes: A case-control study on the Yaoun<strong>de</strong>-Douala roadsection, Cameroon. Int J Inj Contr Saf Promot, 1-8.Bishai, D., Asiimwe, B., Abbas, S., Hy<strong>de</strong>r, A. A., & Bazeyo, W. (2008). Cost-effectiveness oftraffic enforcement: case study from Uganda. Inj Prev, 14(4), 223-227.Damsere-Derry, J., Afukaar, F. K., Donkor, P., & Mock, C. (2008). Assessment of vehiclespeeds on different categories of roadways in Ghana. Int J Inj Contr Saf Promot, 15(2), 83-91.Deery, H. A. (1999). Hazard and risk perception among young novice drivers. J Safety Res,30(4), 225-236.DeJoy, D. M. (1989). The optimism bias and traffic acci<strong>de</strong>nt risk perception. Accid Anal Prev,21(4), 333-340.Delhomme, P. (1991). Comparing one's driving with others': assessment of abilities andfrequency of offences. Evi<strong>de</strong>nce for a superior conformity of self-bias? Accid Anal Prev,23(6), 493-508.Elvik, R. (2008). A survey of operational <strong>de</strong>finitions of hazardous road locations in someEuropean countries. Accid Anal Prev, 40(6), 1830-1835.Finn, P., & Bragg, B. W. (1986). Perception of the risk of an acci<strong>de</strong>nt by young and ol<strong>de</strong>rdrivers. Accid Anal Prev, 18(4), 289-298.Flahault, A., Cadilhac, M., & Thomas, G. (2005). Sample size calculation should beperformed for <strong>de</strong>sign accuracy in diagnostic test studies. J Clin Epi<strong>de</strong>miol, 58(8), 859-862.Geurts, K., & Wets, G. (2003). Black Spot Analysis Methods: Literature Review (No. RA-2003-07). Diepenbeek: Steunpunt Verkeersveiligheid Bij Stijgen<strong>de</strong> Mobiliteit.Geurts, K., Wets, G., Brijs, T., Vanhoof, K., & Karlis, D. (2006). Ranking and selectingdangerous crash locations: correcting for the number of passengers and Bayesian rankingplots. J Safety Res, 37(1), 83-91.Gol<strong>de</strong>nbeld, C., & van Schagen, I. (2007). The credibility of speed limits on 80 km/h ruralroads: The effects of road and person(ality) characteristics. Accid Anal Prev, 39(6), 1121-1130.Harre, N. (2000). Risk evaluation, driving, and adolescents: a typology. Dev Rev, 20, 206-226.Hijar, M., Carrillo, C., Flores, M., Anaya, R., & Lopez, V. (2000). Risk factors in highwaytraffic acci<strong>de</strong>nts: a case control study. Accid Anal Prev, 32(5), 703-709.Hosmer, D. W., & Lemeshow, S. (2000). Applied Logistic Regression (Second ed.). Danvers,MA: John Wiley & Sons, Inc.Jamison, D. T., Mosley, W. H., Measham, A. B., & Bobadilla, J. L. (Eds.). (1993). DiseaseControl Priorities in Developing Countries. Washington, DC: Oxford University Press.Kanellaidis, G., Zervas, A., & Karagioules, V. (2000). Drivers' Risk Perception of RoadDesign Elements. Transportation Human Factors, 2(1), 39-48.Konstantopoulos, P., Chapman, P., & Crundall, D. Driver's visual attention as a function ofdriving experience and visibility. Using a driving simulator to explore drivers' eye movementsin day, night and rain driving. Accid Anal Prev, 42(3), 827-834.Lewis-Evans, B., & Charlton, S. G. (2006). Explicit and implicit processes in behaviouraladaptation to road width. Accid Anal Prev, 38(3), 610-617.131
Majdza<strong>de</strong>h, R., Khalagi, K., Naraghi, K., Motevalian, A., & Eshraghian, M. R. (2008).Determinants of traffic injuries in drivers and motorcyclists involved in an acci<strong>de</strong>nt. AccidAnal Prev, 40(1), 17-23.Mayhew, D. R., Simpson, H. M., & Pak, A. (2003). Changes in collision rates among novicedrivers during the first months of driving. Accid Anal Prev, 35(683-91).McKenna, F. P., Horswill, M. S., & Alexan<strong>de</strong>r, J. L. (2006). Does anticipation training affectdrivers' risk taking? J Exp Psychol Appl, 12(1), 1-10.McKenna, F. P., Stanier, R. A., & Lewis, C. (1991). Factors un<strong>de</strong>rlying illusory selfassessmentof driving skill in males and females. Accid Anal Prev, 23, 45-52.Milleville-Pennel, I., Hoc, J.-M., & Jolly, E. (2007). The use of hazard road signs to improvethe perception of severe bends. Accid Anal Prev, 39(4), 721-730.Mohan, D. (2002). Road safety in less-motorized environments: future concerns. Int JEpi<strong>de</strong>miol, 31(3), 527-532.Montella, A. (2010). A comparative analysis of hotspot i<strong>de</strong>ntification methods. Accid AnalPrev, 42(2), 571-581.Morgan, J. F., Duley, A. R., & Hancock, P. A. Driver responses to differing urban work zoneconfigurations. Accid Anal Prev, 42(3), 978-985.National Transport Research Centre. (1985). Traffic Counter measures in Pakistan: NTRCpublication 85. Islamabad: National Transport Research Centre, Ministry of Communication.NHA. (2008). Traffic survey. Islamabad: National Highway Authority (NHA).Pe<strong>de</strong>n, M., Scurfiled, R., Sleet, D., Mohan, D., Hy<strong>de</strong>r, A., & Jarawan, E. (2004). World reporton road traffic injury prevention. Geneva: World Health Organization.Perneger, T., & Smith, G. S. (1991). The driver's role in fatal two-car crashes: a paired "casecontrol"study. Am J Epi<strong>de</strong>miol, 134(10), 1138-1145.Rosenbloom, T., Shahar, A., Elharar, A., & Danino, O. (2008). Risk perception of driving as afunction of advanced training aimed at recognizing and handling risks in <strong>de</strong>manding drivingsituations. Accid Anal Prev, 40(2), 697-703.Ross, A., Bagunley, C., Hills, B., McDonald, M., & Silcock, D. (1991). Towards safer roadsin <strong>de</strong>veloping countries—a gui<strong>de</strong> for planners and engineers. Crowthorne, UK: TransportResearch Laboratory.Rundmo, T., & Iversen, H. (2004). Risk perception and driving behaviour among adolescentsin two Norwegian counties before and after a traffic safety campaign. Safety Sci, 42(1), 1-21.Sabey, B. E., & Taylor, H. (1980). The Known Risks We Run: The Highway. In S. C.Schwing & W. A. Alber (Eds.), Societal Risk Assessment: How safe is safe enough. NewYork: Plenum Press.Sagberg, F., & Bjornskau, T. (2006). Hazard perception and driving experience among novicedrivers. Accid Anal Prev, 38(2), 407-414.Sobngwi-Tambekou, J., Bhatti, J., Kounga, G., Salmi, L.-R., & Lagar<strong>de</strong>, E. (2010). Roadtraffic crashes on the Yaoundé–Douala road section, Cameroon Accid Anal Prev, 42(2), 422-426.Sümer, N., Ünal, A. B., Birdal, A., Çinar, P., & Çevikoglu, S. (2007). Comparison of selfreportedand computer-based Hazard perception skills among novice and experienceddrivers. Paper presented at the Fourth International Driving Symposium on Human Factors inDriver Assessment, Training and Vehicle Design, Stevenson, Washington.SWOV. (2008). SWOV fact sheet: hazard perception. Leidschendam: SWOV Institute forRoad Safety Research.Trankle, U., Gelau, C., & Metker, T. (1990). Risk perception and age-specific acci<strong>de</strong>nts ofyoung drivers. Accid Anal Prev, 22(2), 119-125.World Health Organization. (2009). Global Status Report on Road Safety. Geneva: WHO.132
Table 1. Characteristics of high- and low-risk sites on Yaoundé-Douala and Karachi-Halaroad sectionsSite factorsPakistanCameroonHigh-risk (%) Low-risk (%) High-risk (%) Low-risk (%)N=16 N=16 N=10 N=10Straight 87 87 20 50Irregular road shoul<strong>de</strong>r 81 81 100 90Irregular surface conditions 75 63 90 40Lane width ≤ 8 75 100 80 90Flat 62 81 50 60Visible road si<strong>de</strong> obstacle 50 38 100 90Vertical road sign 38 19 40 10Built-up road section 31 56 50 10Intersection 31 31 40 0U-turn 19 19 0 0Diversion 13 6 0 0Continuous road-markings 13 0 50 10Traffic factorsVisible heavy vehicle 88 69 40 40Same direction moving vehicle 81 88 60 60Maneuvering vehicle (overtake, crossing) 69 56 30 10Opposite direction moving vehicle 25 19 40 50Visible pe<strong>de</strong>strian 19 31 50 20Visible motorcyclists 13 19 10 0Rain 0 0 20 20Wet surface 0 0 70 50133
Table 2. Characteristics of Pakistani drivers inclu<strong>de</strong>d in sample (N=100).Proportion (%) Recent crash (%)N=100 N=20Age (years)-18-25 9 5- 26-35 38 30- 36-45 28 45- > 45 25 20Vehicle driven-Truck 33 30-Motorcar 43 45-Bus 11 0-Mini-bus 6 15-Mini-truck 5 5-Motorcycle 2 5Permanent domicile-Karachi 54 50-Sindh 9 20-Punjab 29 20-NWFP/Baluchistan 8 10Education (years)- None 22 35- 1-5 22 10- 6-10 37 40- >10 19 15Profession-Driver 85 85-Other 15 15Married 88 80Familiar with road 83 90Licensed after test 45 50Seat-belt use-None 27 20-Occasional 47 55-Frequent 26 25Sleepy driving 29 40Phone dialing 84 80Phone receiving 92 85Traffic Ticket 49 50Drunk driving 2 10134
Table 3. Differences in hazard perception and preferred speeds for high- and low-risk sitepairs on Yaoundé-Douala and Karachi-Hala road sectionsSite hazard perception Traffic hazard perception Difference in traffic speedSite pair D + D ++ D - D - - P D + D ++ D - D - - P Mean P ICC 95% CIPakistan1 16 37 4 5
Table 4. Factors associated with hazard perception at high- and low-risk sites on Yaoundé-Douala and Karachi-Hala road sectionsMo<strong>de</strong>l 1 Mo<strong>de</strong>l 2 Mo<strong>de</strong>l 3OR 95% CI OR 95% CI OR 95% CIDriverAge (years)-18-25 1.93 1.50-2.48 1.95 1.71-2.22 2.09 1.53-2.82- 26-35 1.21 1.03-1.42 1.20 1.12-1.30 1.23 1.02-1.49- 36-45 1 1 1- > 45 1.00 0.84-1.19 1.00 0.91-1.08 1.00 0.81-1.23Vehicle driven- Truck * 1 1- Motorcar 0.71 0.62-0.82 0.70 0.65-0.75 0.69 0.58-0.81- Mini-bus 0.85 0.64-1.13 0.85 0.73-0.98 0.83 0.61-1.16- Mini-truck 0.68 0.50-0.92 0.67 0.58-0.78 0.66 0.46-0.94- Bus 1.38 1.10-1.74 1.39 1.24-1.55 1.40 1.08-1.86SiteCameroon vs. Pakistan 6.53 4.91-8.68 6.88 5.26-9.02 7.61 6.55-8.85Straight vs. curve 0.72 0.58-0.88 0.69 0.56-0.86 0.69 0.62-0.76Irregular vs. regular road surface 4.78 3.74-6.09 4.61 3.71-5.75 5.36 4.71-6.11Flat vs. hill 0.57 0.48-0.69 0.54 0.45-0.65 0.54 0.50-0.60Intersection vs. none 1.46 1.13-1.90 1.40 1.08-1.82 1.49 1.30-1.73Work zone 24.34 15.00-39.51 23.33 14.43-37.71 31.82 24.53-41.26Lane width ≤ 8 m vs. > 8 m- High-risk 0.51 0.43-0.61 0.50 0.37-0.68 0.48 0.42-0.56- Low-risk 18.48 10.39-32.85 22.64 12.42-41.26 23.57 17.29-32.14Built-up area vs. rural- High-risk 0.58 0.51-0.68 0.67 0.49-0.90 0.57 0.46-0.69- Low-risk 2.04 1.51-2.74 2.29 1.69-3.09 2.18 1.86-2.56Vertical road sign- High-risk 2.75 2.38-3.16 2.64 2.02-3.44 2.94 2.48-3.50- Low-risk 0.50 0.34-0.72 0.50 0.36-0.70 0.47 0.39-0.58U-turn- High-risk 8.00 6.36-10.22 7.69 5.09-11.62 9.58 7.50-12.24- Low-risk 0.62 0.39-0.97 0.65 0.43-0.99 0.60 0.47-0.76TrafficHeavy traffic 0.37 0.29-0.47 0.41 0.33-0.51 0.34 0.30-0.39Maneuvering vehicle 1.91 1.50-2.42 1.82 1.45-2.32 2.01 1.77-2.29Oppositely coming traffic 2.05 1.56-2.69 2.15 1.64-2.82 2.18 1.88-2.53Motorcycle 0.53 0.38-0.75 0.52 0.37-0.74 0.51 0.43-0.61Rain- High-risk 0.19 0.15-0.24 0.17 0.11-0.27 0.16 0.13-0.20- Low-risk 0.47 0.29-0.78 0.48 0.29-0.79 0.45 0.35-0.58OR – Odds ratio95% CI – 95% confi<strong>de</strong>nce intervalMo<strong>de</strong>l 1 – Without random effectMo<strong>de</strong>l 2 – Site as random effectMo<strong>de</strong>l 3 – Driver as random effect* Motorcyclists were not analyzed separately as no differences were observed.136
Appendix 8: Study V supplementary resultsTable 20. Driver age, sex, and vehicles driven on Karachi-Hala road section (July 2009)N (%) Seat belt / Phelmet useVehicle driven
Table 21. Situational factors at high- and low- risk site pairs on Yaoundé-Douala and Karachi-Hala road sectionsPair Site hazards Traffic hazardsFlat Curve IrregularsurfaceIrregularshoul<strong>de</strong>rBuilt-upRoadsi<strong>de</strong>obstaclesIntersection SamedirectionOppositedirectionPe<strong>de</strong>strianmovementMotorcyclistSpeeding/OvertakingPakistan1 D 01 D 10 D 10 C 11 D 01 C 11 D 01 C 11 C 00 D 01 C 00 C 00 C 00 C 002 D 01 C 00 C 11 C 11 D 01 C 00 D 01 C 11 D 01 D 01 D 01 C 11 C 00 C 003 C 11 C 00 D 10 D 10 D 10 D 10 D 10 C 11 D 01 D 10 C 00 C 00 C 00 C 004 C 00 C 00 D 10 D 10 C 00 D 10 D 10 C 11 D 10 D 10 D 10 C 11 C 00 C 005 C 11 C 00 D 10 C 11 C 00 C 00 C 00 D 10 C 00 C 00 C 00 D 10 C 00 C 006 C 11 D 01 C 11 C 11 C 11 C 11 D 01 D 01 D 01 C 00 C 00 D 01 C 00 C 007 D 10 D 10 C 11 C 11 D 10 D 10 D 10 D 01 C 00 C 00 C 00 C 11 C 00 C 008 D 01 C 00 D 10 C 11 D 01 D 01 D 01 C 11 C 00 C 00 C 00 C 11 C 00 C 009 D 01 D 01 D 01 C 11 D 01 D 01 C 00 C 11 C 00 D 01 C 00 C 11 C 00 C 0010 D 10 C 00 D 01 D 01 D 01 C 00 C 00 C 11 D 10 D 01 C 00 D 01 C 00 C 0011 D 01 C 00 C 11 C 11 D 01 D 01 C 00 C 11 C 00 D 01 D 01 C 11 C 00 C 0012 C 11 C 00 D 01 D 01 C 00 C 00 C 00 D 01 C 00 C 00 C 00 D 01 C 00 C 0013 C 11 C 00 C 11 C 11 D 01 C 00 C 00 C 11 C 00 C 00 C 00 D 10 C 00 C 0014 C 11 C 00 C 11 C 11 D 01 C 11 D 01 C 11 C 00 C 00 D 01 D 10 C 00 C 0015 C 11 C 00 D 01 D 01 D 10 D 10 D 10 C 11 D 10 C 00 C 00 D 10 C 00 C 0016 C 11 C 00 D 10 D 10 D 10 D 10 D 10 D 10 D 10 D 10 D 10 D 10 C 00 C 00Cameroon17 C 11 D 10 D 10 C 11 D 10 C 11 D 10 C 00 C 00 D 10 C 00 C 00 C 00 C 1118 C 11 D 10 C 11 C 11 D 10 C 11 C 00 D 01 D 01 C 00 C 00 C 00 D 01 C 1119 D 01 C 11 D 10 C 11 D 10 C 11 C 00 C 11 C 11 C 11 C 00 C 00 C 00 C 0020 C 11 D 10 C 11 C 11 C 00 D 10 C 00 C 00 D 01 C 00 C 00 C 00 D 01 C 1121 D 01 C 11 D 10 C 11 D 10 C 11 D 10 D 10 C 00 D 10 C 00 C 00 C 00 D 1022 C 00 C 11 C 11 C 11 D 01 C 11 C 00 C 11 D 01 C 00 C 00 D 01 C 00 D 1023 C 00 C 11 D 01 C 11 C 00 C 11 D 10 D 01 C 00 C 11 C 00 C 00 C 00 D 0124 D 01 D 10 D 10 C 11 C 00 C 11 C 00 C 11 D 10 C 00 C 00 D 10 D 10 D 1025 D 10 D 01 D 10 C 11 D 10 C 11 D 10 D 10 D 10 D 10 D 10 D 10 C 00 D 1026 D 10 C 00 D 10 D 10 C 00 C 11 C 00 C 11 C 11 C 00 C 00 D 10 D 10 D 01Total- D 10 4 6 12 4 9 6 9 4 6 6 3 8 2 4- D 01 8 3 5 3 9 3 5 5 6 4 3 4 2 2C 11 Concordant high- and low-risk site pair: hazard presentC 00 Concordant high- and low-risk site pair: hazard absentD 10 Discordant high- and low-risk site pair: hazard at crash-site onlyD 01 Discordant high- and low-risk site pair: hazard at non crash site onlyRainWetsurface© Bhatti, PPCT, INSERM U897 138
Table 22. Driver-related factors associated with hazard perception of sites onYaoundé-Douala and Karachi-Hala road sectionsSample Perception P*Safe HazardousN=2 697 N=2 503N % %Driver characteristicsAge (y) 45 25 25.8 24.1Education (y) 0.06- None 22 22.8 21.1- 1-5 22 21.8 22.3- 6-10 37 35.6 38.6- >10 19 19.8 18.1Profession 0.02- Driver 85 83.9 86.1- Other 15 16.1 13.9Marital status 0.88- Married 88 88.1 87.9- Single 12 11.9 12.1Permanent domicile 0.001- Karachi 54 56.5 51.3- Sindh 9 8.9 9.1- Punjab 29 26.9 31.3- NWFP/Baluchistan 8 7.7 8.3Vehicle driven
Table 23. Situational factors associated with hazard perception of sites on Yaoundé-Douala and Karachi-Hala road sections(Drivers =100)Sites Perception P* Sites Perception P*Safe Hazardous Safe HazardousN=2 697 N=2 503 N=2 697 N=2 503N % % % N % % %Site situation Site situationVertical road profile
RésuméIntroduction : La sécurité routière sur le réseau interurbain est un problème majeur <strong>de</strong> santé publique dans les Pays <strong>à</strong> Revenu Bas et Moyen(PRBM) mais peu d'attention y a été consacrée. Les objectifs <strong>de</strong> cette <strong>thèse</strong> étaient d’évaluer le far<strong>de</strong>au <strong>de</strong>s traumatismes en relation avec letrafic interurbain, la déclaration <strong>de</strong>s usagers blessés dans <strong>de</strong>s bases <strong>de</strong> données différentes, d’analyser l’association entre les facteurssituationnels (caractéristiques physiques et circonstances environnementales) et les sites <strong>de</strong>s acci<strong>de</strong>nts et la perception <strong>de</strong> la dangerosité <strong>de</strong>stronçons acci<strong>de</strong>ntogènes dans les PRBM. Métho<strong>de</strong>s et résultats : Pour répondre <strong>à</strong> ces objectifs, cinq étu<strong>de</strong>s spécifiques ont été réaliséesdans <strong>de</strong>ux PRBM, le Cameroun et le Pakistan. L’étu<strong>de</strong> I a évalué le nombre <strong>de</strong> tués par véhicules-km parcourus et les facteurs qui leurétaient associés, en utilisant les rapports <strong>de</strong> police entre 2004 et 2007 sur l’axe Yaoundé-Douala, Cameroun. Le taux <strong>de</strong> mortalité était <strong>de</strong> 73par 100 millions véhicules km parcourus, un taux 35 fois plus élevé que sur un même type <strong>de</strong> route en pays <strong>à</strong> revenu élevé. La mortalité étaitplus élevée pour les acci<strong>de</strong>nts impliquant <strong>de</strong>s usagers vulnérables, les véhicules roulant en sens opposé et ceux dus <strong>à</strong> une défaillancemécanique, y compris un éclatement <strong>de</strong> pneu. L’étu<strong>de</strong> II a évalué les différences <strong>de</strong> déclaration d’acci<strong>de</strong>nts faites par les services <strong>de</strong> police,d’ambulance et <strong>de</strong>s urgences en 2008 sur l’axe Karachi-Hala, Pakistan. La mortalité était <strong>de</strong> 53 par 10 9 véhicules-km parcourus ; le taux <strong>de</strong>mortalité était 13 fois plus élevé sur cet axe par rapport <strong>à</strong> un même type <strong>de</strong> route en France. La police a déclaré un mort sur cinq et un blességrave sur dix. Les usagers <strong>de</strong> la route vulnérables, y compris les piétons et <strong>de</strong>ux-roues ont été <strong>de</strong>ux fois moins déclarés par la police que parles services d'ambulance ou <strong>de</strong>s urgences. L’étu<strong>de</strong> III a étudié les facteurs situationnels associés aux sites <strong>de</strong>s acci<strong>de</strong>nts sur l’axe Yaoundé-Douala par une approche <strong>de</strong> type cas-témoins. Les facteurs tels que le profil routier plat (rapport <strong>de</strong> cotes [RC] ajusté =1,52 ; intervalle <strong>de</strong>confiance <strong>à</strong> 95 % [IC95 %]=1,15-2,04), les surfaces irrégulières (RC=1,43 ; IC95 %=1,04-1,99), les obstacles <strong>à</strong> proximité (RC=1,99 ;IC95 %=1,09-3,63) et les intersections <strong>à</strong> trois (RC=3,11 ; IC95 %=1,15-8,39) ou <strong>à</strong> quatre directions (RC=3,23 ; IC95 %=1,51-6,92) étaientsignificativement associés <strong>à</strong> <strong>de</strong>s sites d’acci<strong>de</strong>nts corporels. De plus, la probabilité <strong>de</strong>s acci<strong>de</strong>nts augmentait dans <strong>de</strong>s zones urbaines situéesdans <strong>de</strong>s régions <strong>de</strong> plaine (RC=2,23 ; IC95 %=1,97-2,77). L’étu<strong>de</strong> IV a étudié le far<strong>de</strong>au <strong>de</strong>s traumatismes dus aux acci<strong>de</strong>nts ainsi que lesfacteurs associés dans <strong>de</strong>s zones en travaux sur l’axe Karachi-Hala en utilisant les métho<strong>de</strong>s <strong>de</strong> cohorte historique. Un tiers <strong>de</strong> la mortalitéroutière était survenu dans <strong>de</strong>s zones en travaux et le risque <strong>de</strong> mortalité était quatre fois plus élevé dans ces zones que dans les autres zones.Un acci<strong>de</strong>nt sur <strong>de</strong>ux a eu lieu entre <strong>de</strong>s véhicules roulant en sens opposé dans ces zones. L’étu<strong>de</strong> V a étudié la perception <strong>de</strong> la dangerosité<strong>de</strong>s tronçons acci<strong>de</strong>ntogènes (au moins 3 acci<strong>de</strong>nts sur 3 ans) et non acci<strong>de</strong>ntogènes (aucun acci<strong>de</strong>nt déclaré) sur les <strong>de</strong>ux axes <strong>de</strong>sprécé<strong>de</strong>ntes étu<strong>de</strong>s, en montrant leurs vidéos <strong>à</strong> <strong>de</strong>s conducteurs volontaires pakistanais. Les conducteurs n’ont perçu comme dangereux quela moitié <strong>de</strong>s tronçons acci<strong>de</strong>ntogènes. La perception <strong>de</strong> la dangerosité <strong>de</strong>s tronçons plats et droits était plus faible par rapport aux tronçonsen courbes et avec une pente. La perception <strong>de</strong> la dangerosité en zone urbaine d’un tronçon acci<strong>de</strong>ntogène était significativement moinsélevée (RC=0,58 ; IC95 %=0,51-0,68) que celle d’un tronçon non acci<strong>de</strong>ntogène ayant la même caractéristique (RC=2,04 ; IC95 %=1,51-2,74). La perception <strong>de</strong> la dangerosité d’un tronçon acci<strong>de</strong>ntogène avec panneau <strong>de</strong> signalisation était significativement plus élevée(RC=2,75 ; IC95 %=2,38-3,16) par rapport <strong>à</strong> <strong>de</strong>s tronçons non acci<strong>de</strong>ntogènes ayant la même caractéristique (RC=0,50 ; IC95 %=0,34-0,72).Conclusion : Cette <strong>thèse</strong> montre combien <strong>de</strong>s métho<strong>de</strong>s épidémiologiques simples, mais novatrices, peuvent être utiles pour évaluer lefar<strong>de</strong>au <strong>de</strong>s traumatismes par acci<strong>de</strong>nts et leurs facteurs <strong>de</strong> risques dans les PRBM. Ces pays sont confrontés <strong>à</strong> un énorme far<strong>de</strong>au <strong>de</strong>morbidité routière qui est souvent sous-déclarée dans les données <strong>de</strong> la police. Un système <strong>de</strong> surveillance fiable et vali<strong>de</strong> est nécessaire dansles PRBM. De plus, la politique <strong>de</strong> prévention pourrait être améliorée par une meilleure communication d’information entre les autoritésroutières et policières concernant les facteurs situationnels. De la même façon, les mesures <strong>de</strong> sécurité dans les zones en travaux <strong>de</strong>vraientêtre contrôlées par un système dédié. Enfin, la sécurité routière sur les routes interurbaines dans les PRBM pourrait être améliorée en rendantles routes plus « informant », en particulier avec l’application <strong>de</strong> mesures peu couteuses telles que les panneaux <strong>de</strong> signalisations sur lestronçons acci<strong>de</strong>ntogènes.Mots Clés: Acci<strong>de</strong>nts <strong>de</strong> la circulation; pays en développement ; trauma; usagers vulnérables.AbstractBackground: Interurban traffic safety is a major public health problem, but has received little attention in Low- and Middle-IncomeCountries (LMICs). The objectives of this thesis were to assess the bur<strong>de</strong>n of injury related to interurban traffic, and reporting of theseinjuries in different datasets, to analyze situational factors (physical characteristics and environmental circumstances) associated with crashsites, and road hazard perception of high-risk crash sites in LMICs. Methods and results: These objectives were assessed in five specificstudies conducted in two LMICs, Cameroon and Pakistan. In study I, traffic fatality per vehicle-km and associated crash factors wereassessed using police reports for years 2004 to 2007, on the two-lane Yaoundé-Douala road section in Cameroon. Traffic fatality was 73 per100 million vehicle-km, a rate 35 times higher than a similar road in a high-income country. Fatality was higher for crashes involvingvulnerable road users, crashes between oppositely-moving vehicles, and those due to mechanical failure including tyre burst. In study II,traffic injury reporting to police, ambulance, and Emergency Department (ED) in 2008 was assessed, on the four-lane Karachi-Hala roadsection in Pakistan. Crash fatality was over 53 per 10 9 vehicle-km, a rate 13 times higher than a similar road in France. Police reported onlyone out of five fatalities and one out of ten severe injuries. Vulnerable road users were two times less reported in police data than ambulanceor ED data. In study III, situational factors associated with injury crash sites were assessed on the Yaoundé-Douala road section, using casecontrolmethods. Factors such as flat road profiles (adjusted Odds Ratios [OR]=1.52; 95% Confi<strong>de</strong>nce Interval [95%CI]=1.15-2.01),irregular surface conditions (OR=1.43; 95%CI=1.04-1.99), nearby road obstacles (OR=1.99; 95%CI=1.09-3.63), and three- (OR=3.11;95%CI=1.15-8.39) or four-legged (OR=3.23; 95%CI= 1.51-6.92) intersections were significantly associated with injury crash sites.Furthermore, the likelihood of crash increased with built-up areas situated in plain regions (OR=2.33; 95%CI=1.97-2.77). In study IV, trafficinjury bur<strong>de</strong>n and factors associated with Highway Work Zones (HWZs) crashes were assessed on the Karachi-Hala road section, usinghistorical cohort methods. HWZs accounted for one third of traffic fatalities, and fatality per vehicle-km was four times higher in HWZs thanother zones. One out of two HWZ crashes occurred between oppositely moving vehicles. In study V, hazard perception of high-risk (with ≥3 crashes in 3 years) and low-risk sites (no crash reported) from the two above road sections was assessed by showing vi<strong>de</strong>os to voluntaryPakistani drivers. Drivers were able to i<strong>de</strong>ntify only half of the high-risk sites as hazardous. Sites with a flat and straight road profile had alower hazard perception compared to those with curved and slope road profile. High-risk sites situated in built-up areas were perceived lesshazardous (OR = 0.58; 95%CI=0.51-0.68) compared to low-risk sites (OR = 2.04; 95%CI=1.51-2.74) with same road situation. Further,high-risk sites with vertical road signs were more likely to be perceived hazardous (OR = 2.75; 95%CI=2.38-3.16) than low-risk sites (OR =0.50; 95%CI=0.34-0.72) with such signs. Conclusion: This thesis illustrates how innovative yet simple epi<strong>de</strong>miological methods can beuseful in assessing the injury bur<strong>de</strong>n and specific risk factors in LMICs. These countries face a high bur<strong>de</strong>n of interurban road injuries,mostly un<strong>de</strong>r-reported in police data. A reliable and accurate injury surveillance system is nee<strong>de</strong>d in these countries. Moreover, preventionpolicy can be improved by better information transfer between road and police authorities regarding situational factors. Similarly, amonitoring system is required to examine the HWZ safety interventions in these countries. Lastly, interurban road safety can be improved bymaking roads self-explaining, especially by implementing low-cost interventions such as vertical signs at high-risk sites.Keywords: Developing country; highway safety; injury; prevention; vulnerable road users.141